Marketing Mix Modeling Basics
Marketing mix modeling basics: time-series channel impact with adstock and saturation. Use Meridian or Robyn, calibrate with lift tests, not last-click.
Incrementality testing explained: lift formulas, Google iROAS, geo vs user holdouts, and how to calibrate MMM.

TL;DR: Incrementality testing explained simply is a test-versus-control experiment that estimates what would have happened without the spend. Compute incrementality percent as (test conversion rate − control conversion rate) ÷ test conversion rate, then incremental ROAS as incremental revenue ÷ media spend. Use results to calibrate budgets and MMM, not as a daily creative scoreboard.
Platform dashboards love to claim the sale. Finance asks a colder question: would the customer have bought anyway? If you cannot answer that, you are scaling attribution, not growth.
Incrementality testing explained is the practice of withholding ads from a control group (or matched geos) so you can measure causal lift. It sits next to attribution models compared: attribution assigns credit; incrementality estimates cause. Teams that skip the holdout keep buying the story the walled garden sells them.
Key takeaways:
Incrementality testing is a controlled experiment that estimates the causal lift of a marketing treatment by comparing outcomes for people or markets that received the treatment with outcomes for a comparable group that did not.
Attribution says who touched the conversion. Incrementality asks whether the campaign caused conversions that would not have occurred otherwise. Measured frames the incremental conversions as those above and beyond what would have happened anyway (Measured). Google describes a randomized controlled experiment and defines incremental ROAS as newly discovered incremental revenue divided by campaign media spend (Google Think).
This page is the how-and-why spoke. The stack placement lives in attribution models compared. Unit economics context lives in CAC vs LTV benchmarks by industry: a high attributed ROAS with weak incrementality is often a CAC you cannot defend.
Platforms optimize for the credit they can claim. You optimize for profit you would not have earned without the spend. Those are different objective functions.
Why the test fights back:
Open with the math, then pick a design, then schedule the calendar so tests do not poison each other.
1) Incrementality percent (conversion rate form)
From Measured (Measured):
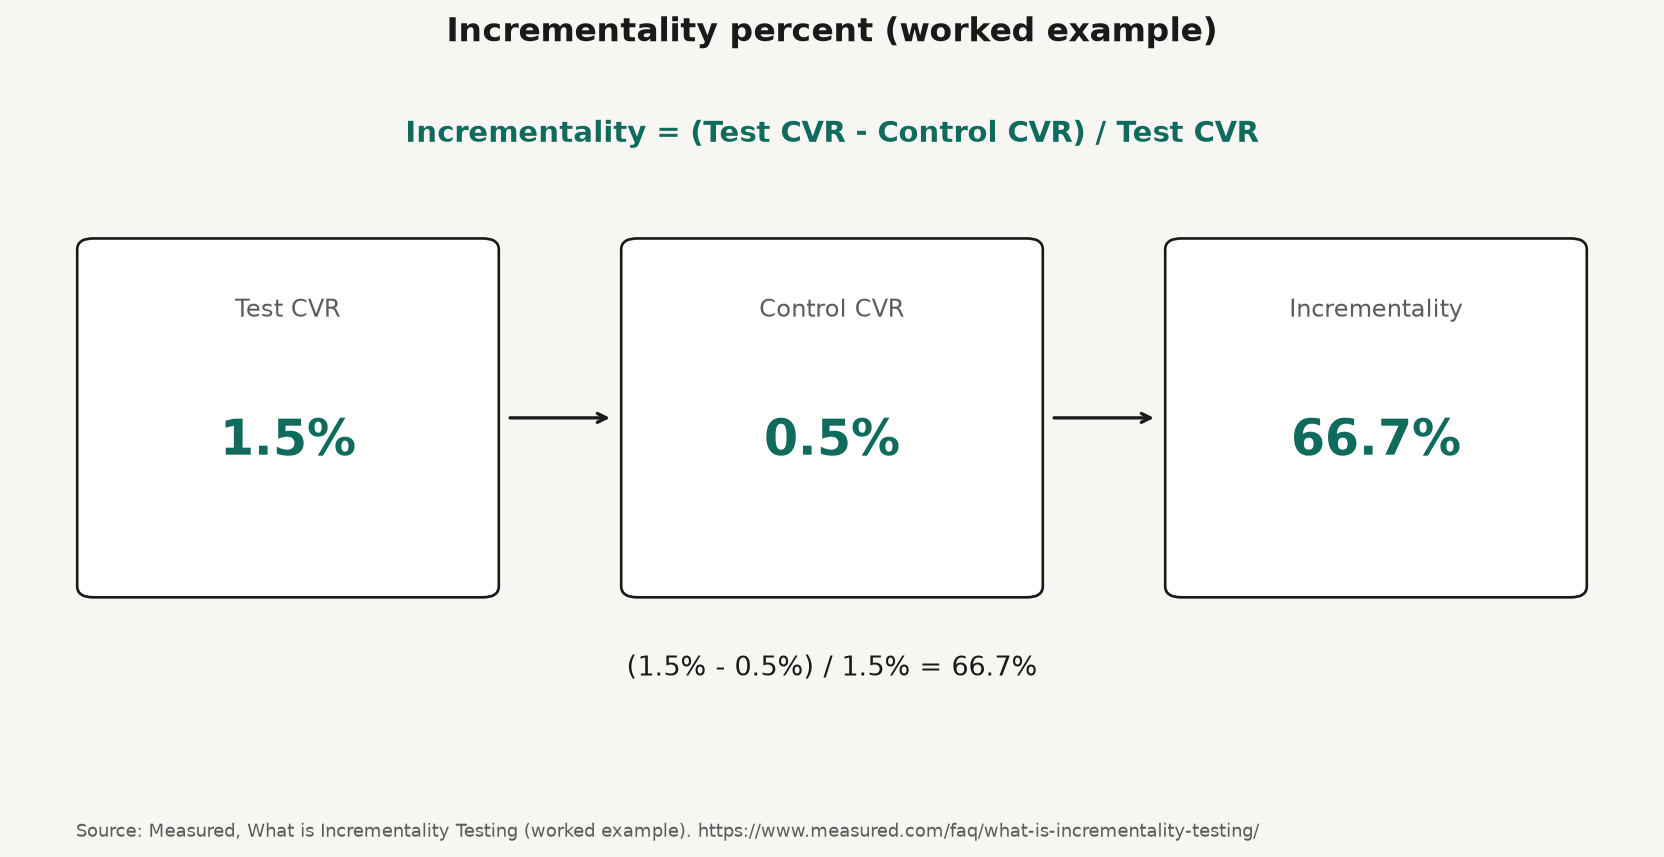
Incrementality = (Test conversion rate − Control conversion rate) ÷ Test conversion rate
Worked example from the same page: test group converts at 1.5%, control at 0.5%.
(1.5% − 0.5%) ÷ 1.5% = 66.7% incrementality
That means about two-thirds of the test group’s conversions are estimated as incremental relative to the control baseline. Conversion here can mean purchases, leads, or another business outcome you define before the test.
2) Incremental ROAS
From Google Think (Google Think):
iROAS = incremental revenue ÷ media spend
Google’s article also walks through illustrative scenarios (£6 and £1.10 incremental return per £1 spent). Treat those as teaching examples, not category averages. There is no public dataset that fixes one median iROAS for every channel and brand.
Source: Measured, What is Incrementality Testing (worked example). https://www.measured.com/faq/what-is-incrementality-testing/
| Design | What you withhold | Best when | Watch-outs |
|---|---|---|---|
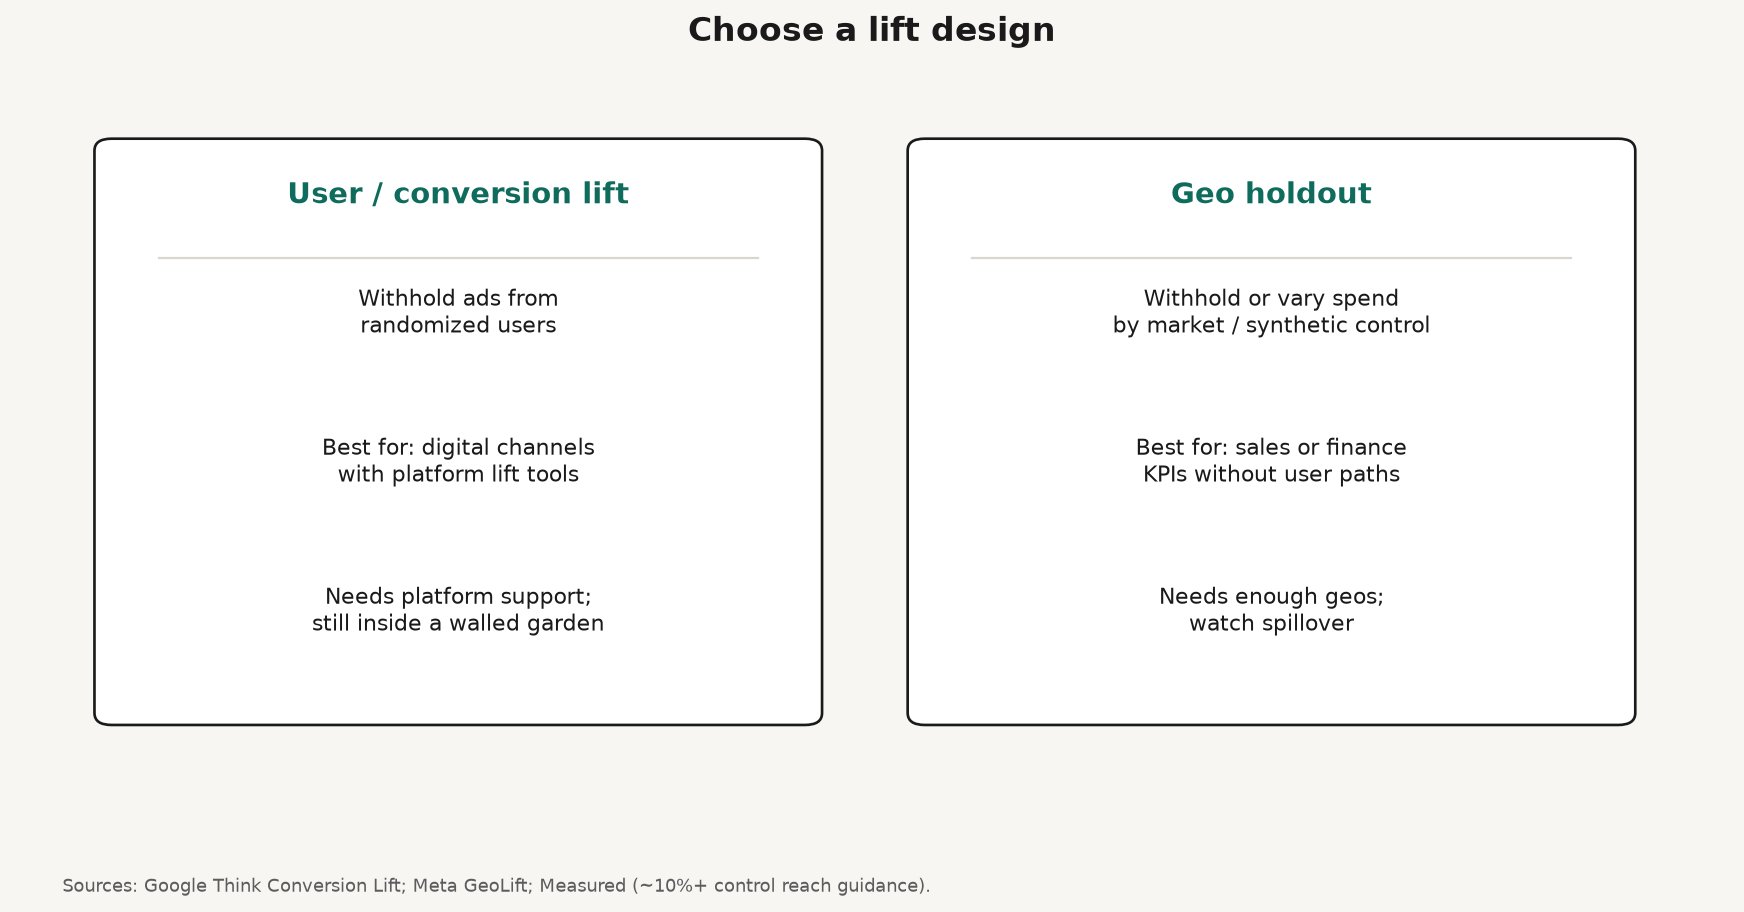
| User / conversion lift | Ads from a randomized user control | Digital channels with platform lift tools; smaller budgets | Needs platform support; still lives inside a walled garden |
| Geo holdout / geo RCT | Spend in matched markets or synthetic controls | You need sales or finance KPIs; privacy-safe aggregates | Needs enough geos and history; commuting spillover |
| Time-based / PSA | Ads in a period or with placebo creative | You cannot split users or geos cleanly | Seasonality and concurrent promos confound |
Google’s Conversion Lift supports user- or geography-based tests inside Google Ads, and notes geo methods that can use first-party finance data without relying on cookies for execution (Google Think). Meta’s open-source GeoLift package implements geo-level lift with synthetic control methods for market selection, power analysis, and inference (GeoLift). Tool demos (including GeoLift vignette lifts) are not your benchmark. Your power analysis is.
Measured’s design note: the control group should represent a minimum of about 10% of total test and control reach (Measured). Undersized controls look cheap and then produce noise you will over-interpret.
Source: Design framing synthesized from Google Think Conversion Lift options and Meta GeoLift; control-size guidance from Measured. https://business.google.com/en-all/think/measurement/incrementality-testing/ · https://github.com/facebookincubator/GeoLift/ · https://www.measured.com/faq/what-is-incrementality-testing/
| Layer | Question | Cadence |
|---|---|---|
| Platform / last-click | Which touch closed? | Hours |
| MTA | How do tracked touches share credit? | Hours to days |
| MMM | How should next quarter’s budget split? | Weeks to months |
| Incrementality | Did this channel cause lift? | Per experiment |
Use incrementality to calibrate MMM and to challenge platform ROAS before you scale. Do not replace daily creative testing with a six-week geo study. That is the wrong instrument. Details on last-click, MTA, and MMM live in attribution models compared.
Google’s guidance: make an annual testing plan, prioritize the highest-impact questions, and avoid overlapping tests across channels that would contaminate the counterfactual (Google Think). If Meta, Search, and a promo all move in the same weeks, your “lift” may be a mess of confounds.
Also freeze the decision rule before you peek: minimum detectable effect, confidence level, primary KPI, and what you will do if iROAS clears or fails your hurdle. Peeking until the chart looks good is how teams launder noise into strategy.
Q: What is incrementality testing in marketing?
A: It is a controlled experiment that compares a group exposed to a campaign with a comparable group that is not, to estimate causal lift. The goal is to measure outcomes that would not have happened without the spend, not just outcomes an ad happened to touch.
Q: How do you calculate incrementality and incremental ROAS?
A: Measured’s conversion-rate form is (test CVR − control CVR) ÷ test CVR. Google defines incremental ROAS as incremental revenue divided by media spend. Use both: the percent shows relative lift; iROAS shows whether the lift paid for the budget.
Q: What is the difference between a geo lift test and conversion lift?
A: Conversion lift usually randomizes users (or uses platform lift tools) inside a digital channel. Geo lift withholds or varies spend across matched markets or synthetic controls and often reads finance or sales KPIs. Pick based on data access, channel, and the decision you need.
Q: How is incrementality testing different from attribution?
A: Attribution assigns credit across observed touches. Incrementality estimates causal impact with a counterfactual. You still need attribution for day-to-day optimization; you need incrementality before you declare a channel’s true return. See attribution models compared.
Q: Is there a standard incremental ROAS benchmark by channel?
A: No public cross-platform census fixes one median iROAS for every channel and brand. Google publishes illustrative scenarios, and operators share anecdotes, but your hurdle should come from contribution margin, CAC vs LTV, and a powered test on your own data.
Incrementality testing explained well is a discipline, not a dashboard skin. Hold out a control, compute lift with a clear formula, translate to iROAS, and let the pre-committed decision move the budget. Use user or geo designs based on the channel and the KPI, keep tests from overlapping, and feed results into MMM instead of arguing with platform ROAS forever.
If you are a merchant who wants creators to sell what you built through co-branded storefronts with a revenue split on every sale, start at feat..
Marketing mix modeling basics: time-series channel impact with adstock and saturation. Use Meridian or Robyn, calibrate with lift tests, not last-click.
Attribution models compared: last-click, multi-touch (MTA), and MMM. EMARKETER reliability ranks, when each fits, and how incrementality calibrates.
Affiliate marketing for startups is an operating system—locks, cost, recruit, rates, tracking, first 100 sales, then diagnose a flat roster.