Product Quiz Conversion Rate Benchmarks (2026)
Product quiz conversion rate benchmarks are a Quiz Denominator Ladder: RevenueHunt 5.5% of completers; ConvertFlow 5.2% of viewers. Not sitewide CVR.
Size guide conversion rate impact is a Size Confidence Ladder: Baymard 83%/87% fail sufficiency; Snipes Fit Finder +3% all-traffic vs a static chart.

TL;DR: Size guide conversion rate impact is a Size Confidence Ladder, not a 9%-14% app-store average. Baymard finds 83% of desktop and 87% of mobile apparel sites fail a sufficiency test. Fit Analytics’ Snipes A/B (n=645,000, all traffic) put Fit Finder at +3% conversion versus a static size chart. Coresight’s 2023 survey puts online apparel returns at 24.4%, with size/fit cited by 53% of respondents.
Merchants Google size guide conversion rate impact and get a mashup: a how-to from Shopify, a listicle quoting 9%-14% lift, a case study that moved conversion from 2.1% to 2.7% after installing an app, then a “Baymard 42% abandoned for sizing” claim that is actually Baymard’s “just browsing” cart reason. Finance averages them. You paste a generic S/M/L table into a footer link and wonder why returns still eat the affiliate sale.
Size guide conversion rate impact matters when the shopper cannot try the garment on, and the only thing standing between a click and a keep is whether they trust the size. This page sits next to product page conversion rate benchmarks, add to cart rate by niche, cart abandonment reasons, and product reviews conversion impact.
Size guide conversion rate impact is the causal change in completed orders (and, later, net revenue after fit returns) when shoppers get usable size and fit information on the product page, measured against a holdout that does not get that information.
It is not “we added a Size Chart tab.” A table of letter sizes with no measurements, no product-type match, and a link two scrolls from the selector is a decoration. Baymard’s sufficiency test is a checklist of ten elements (conventional and numeric sizes, inches and centimeters, international conversions, how-to-measure, product-type match, link next to the selector, Back-button behavior, a service path, model measurements). Fail any one and the site is in the 83% / 87% bucket (Baymard).
It is also not session add-to-cart rate. Add to cart by niche already owns Littledata’s session medians. Fit doubt often dies at the size selector, before the cart. YourSizer’s testing advice is right on the mechanics even when it publishes no census: a change that lifts conversion and raises fit returns can be a net loss. Judge on orders and on returns after the window closes.
The useful name for the job is size confidence. A chart that maps body or garment measurements to a SKU is one rung. A Size Finder that recommends a size is another. Fit reviews are a third. Mixing those rungs into one “size guides lift conversion 12%” slide is how you buy the wrong widget.
Wrong meters buy the wrong guide. You celebrate extra add-to-carts, then pay for the second size that comes back. Size guide conversion rate impact only matters if the page answers “will this fit me?” before the shopper leaves, and if you score keeps, not just carts.
Size guide conversion rate impact works when you name the rung (sufficiency, findability, reviews, interactive vs static, returns), refuse to average vendor before/afters, and measure all traffic, not only people who opened the widget.
| Rung | What you measure | Labeled public anchor | Decision |
|---|---|---|---|
| 1. Sufficiency (Baymard) | Share of apparel sites that pass a 10-element sizing test | Desktop fail 83% (pass 17%); mobile fail 87% (pass 13%) | A missing or generic chart is the default, not the exception |
| 2. Usage / findability (Baymard) | Whether testers used and could find the guide | 84% of participants used sizing info; several never found the link | Put the link next to the size selector, not in the footer |
| 3. Review complement (Baymard 2026) | What apparel shoppers want from reviews | Size/fit 48% vs quality 43% (n=1,922) | A chart without fit reviews still leaves a translation gap |
| 4. Interactive vs static, all traffic (Snipes) | Conversion, returns, size sampling with Fit Finder vs a static chart | +3% CVR, -2% returns, -8% footwear sampling; n=645,000; 2 months | This is incrementality versus a chart, not versus nothing |
| 5. Returns cited reason (Coresight 2023) | Why brands say apparel comes back | Online apparel return 24.4%; size/fit cited by 53% of n=100 | Conversion without a returns window is half a test |
| 6. Static-chart-only order lift | Shopify-wide % for “added a size chart” | no public dataset | Do not paste 9%-14% as a planning number |
Sources: Baymard sizing; Baymard size-guide examples; Baymard 2026 apparel survey; Fit Analytics / Snipes; Coresight 2023.
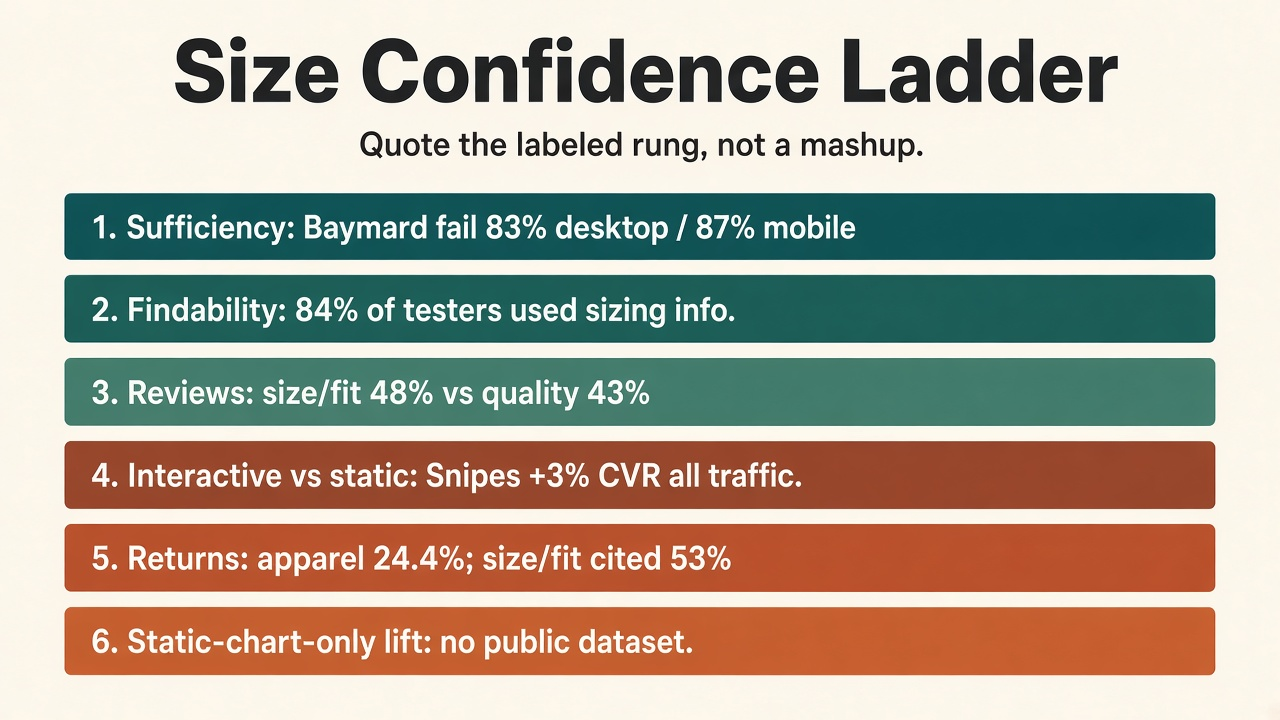
Source: Baymard Institute; Fit Analytics Snipes; Coresight Research 2023. URLs in the table.
Baymard’s ten elements are the unglamorous list vendors skip. Conventional and numeric sizes. Inches and centimeters. International conversions if you ship across systems. How to measure, with a body diagram if you can. A chart that matches the product on the page (a clothing chart on a backpack is “almost just worse than nothing,” in one tester’s words). The Size Guide link beside the selector. Browser Back closing the overlay onto the PDP, not the PLP. A customer-service path inside the guide. Model height and size worn (Baymard).
That is why “we have a size chart” and “we pass sufficiency” are different sentences. The 83% / 87% fail rates are not “sites with no table.” They are sites missing one or more of those elements.
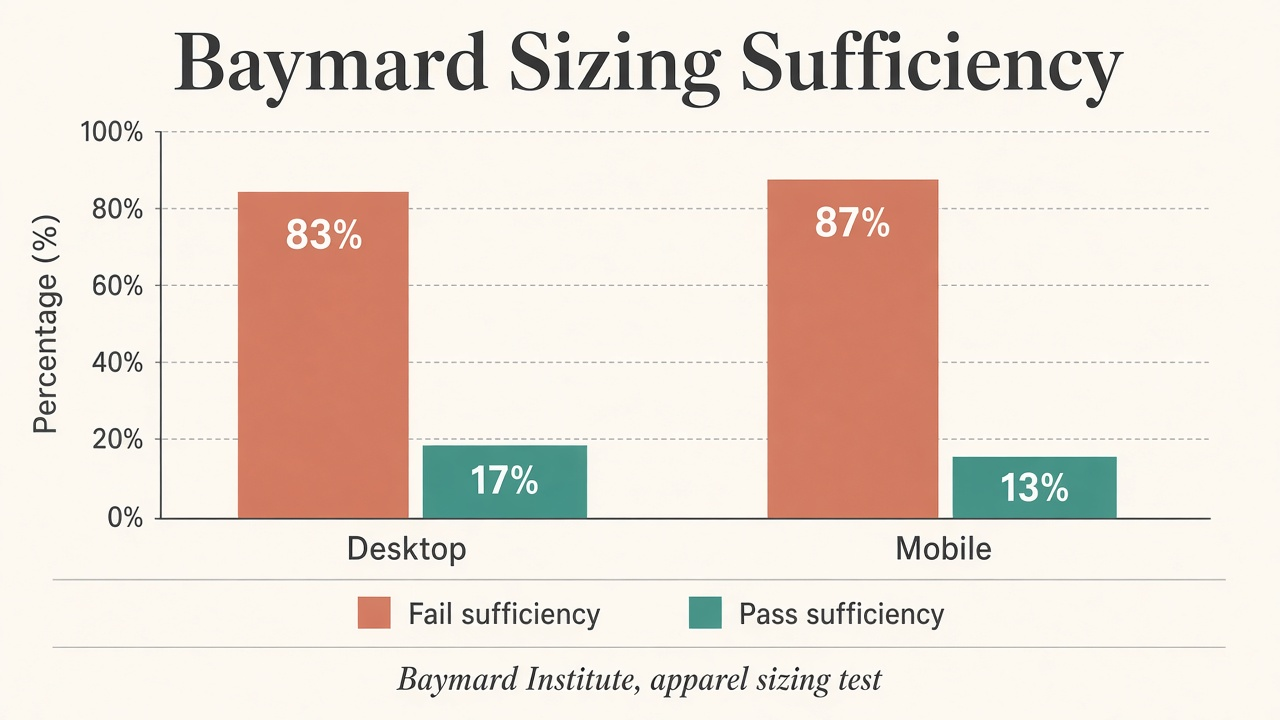
Source: Baymard Institute, 83% of Apparel Sites Don’t Provide Sufficient Sizing Information. https://baymard.com/research-articles/apparel-size-information.
Fit Analytics markets a 4%-6% average conversion increase and a 2%-4% average return decrease for Fit Finder, plus 30% of purchases on its top 15 shops. Sample unpublished. Treat that homepage band as vendor average, not a census (Fit Analytics).
Snipes is the cell worth quoting. Control: a generic size-help button to a static chart. Variant: Fit Finder. Scoring: all traffic, not only people who asked for help. 645,000 shoppers, two months, snipes.de, then a rollout to other EU sites. +3% conversion, -2% returns, -8% footwear size sampling (Fit Analytics).
That design answers the right comparison: widget versus chart, on the whole store, not “users of the widget versus everyone else.” User-versus-nonuser gaps (True Fit case studies, Loveable’s 2.1% → 2.7% before/after) mix selection with treatment. People who open a fit tool were already closer to a buy. Keep those off the primary ladder (ShopPlaza / Loveable).
Coresight’s 2023 self-report sits on a lower rung: among the 29% of apparel respondents who already had a size-recommender, 80% said it increases conversion. That is a poll of operators, MoE ±10%, n=100. It is not Snipes (Coresight).
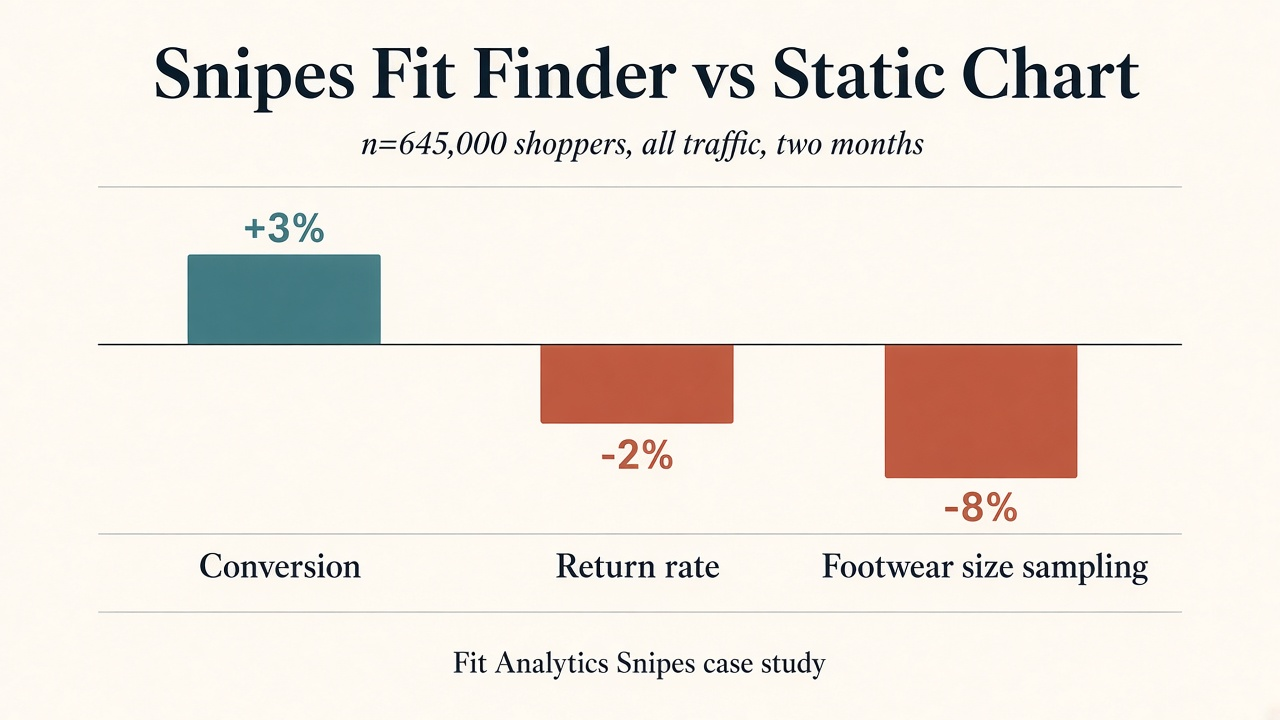
Source: Fit Analytics, Snipes case study. https://fitanalytics.com/case-studies/snipes.
WWD’s May 2026 write-up of Coresight × Alvanon restates the dollar stack on a newer market: US online apparel and footwear $201.1B in 2025, estimated 23.4% return rate, $47.1B returned, with sizing and fit “approximately 70% of all returns” in that report’s last-12-months window. Bershka’s sizing-standards overhaul with Alvanon is labeled a 10% reduction in returns, not a conversion lift (WWD).
Do not smash 70% of units (2026 report, as summarized) into 53% of respondents (2023 survey). They are different meters. Both say fit is the dominant apparel-return story. Neither is a size-chart A/B.
Reddit already talks like operators. One Shopify merchant credited Fit Analytics with “massively increased conversion and AOV as well as halving returns” (r/shopify). Treat that as Low-confidence anecdote. Another thread on virtual try-on put the day-to-day work on photos, video, and size guides, not AR (r/ecommerce). Plus-size founders still split the page into “will it fit me?” versus a measurement table (r/shopify_growth).
If you also run a sticky add to cart bar, the same rule applies: a persistent button that cannot finish the size job is a click generator. Size confidence has to live in the control, or the bar just scrolls people back to a dropdown.
Test size guide conversion rate impact as a holdout on orders and on fit returns, not as a theme toggle you ship on every SKU. Duplicate the template, keep the Size Guide link next to the selector, and do not call the test done until the return window closes. Each step is at most two sentences.
Q: Do size guides increase conversion rate? A: They can, when they resolve fit doubt on the page. Baymard shows most apparel sites still fail a 10-element sufficiency test (83% desktop / 87% mobile). The cleanest public incrementality number versus a static chart is Snipes’ Fit Finder A/B at +3% conversion on all traffic, not a 9%-14% mashup.
Q: What is the difference between a size guide and a fit finder? A: A size guide is a chart (body or garment measurements, conversions, how to measure). A fit finder recommends a size from those measurements plus purchase and return data. Baymard wants both (36% of its test sites had no finder); Snipes measured finder versus chart, not finder versus nothing.
Q: Where should the size guide sit on a product page? A: Next to the size selector, as a modal that Back returns to the PDP. Baymard watched testers miss a “Size info & fit” tab under the gallery and land on the PLP when they hit Back from an overlay.
Q: How much do size and fit returns cost apparel sites? A: Coresight’s 2023 survey estimates a 24.4% online apparel return rate (n=100), with size/fit the top cited reason (53% of respondents). The 2026 Coresight × Alvanon stack, as reported by WWD, uses 23.4% and about 70% of returns tied to sizing/fit on a $201.1B 2025 market. Those are different methods, so do not average them.
Q: Can I quote 9%-14% as the conversion lift from adding a size chart? A: No: that band is a vendor mashup with no named public census behind it. There is no public dataset for static-chart-only order lift across Shopify. Quote Baymard’s fail rates, Snipes’ +3%, or your own holdout.
Size guide conversion rate impact is a confidence stack, not a plugin percentage. Most apparel PDPs still fail Baymard’s sufficiency test. Shoppers will use a guide they can find, then borrow fit from reviews. The honest incrementality cell versus a static chart is Snipes’ all-traffic +3%, with returns moving the other way. Quote the labeled rung, or run the holdout through the return window.
If you built apparel people will actually sell, list it on feat. so affiliates get a storefront that can answer fit before the click dies.
Product quiz conversion rate benchmarks are a Quiz Denominator Ladder: RevenueHunt 5.5% of completers; ConvertFlow 5.2% of viewers. Not sitewide CVR.
Sticky add to cart conversion lift: Vitals 9.3% of orders involve the bar; Growth Rock +7.9% desktop vs scroll-to-section with no order lift.
Exit-intent popup benchmarks: Omnisend 2025 onExit ~1.8% vs scroll 2.1%; OptiMonk cart-abandon 17.12% is a different job. Not list-growth averages.