Size Guide Conversion Rate Impact (2026)
Size guide conversion rate impact is a Size Confidence Ladder: Baymard 83%/87% fail sufficiency; Snipes Fit Finder +3% all-traffic vs a static chart.
Product quiz conversion rate benchmarks are a Quiz Denominator Ladder: RevenueHunt 5.5% of completers; ConvertFlow 5.2% of viewers. Not sitewide CVR.

TL;DR: Product quiz conversion rate benchmarks are a Quiz Denominator Ladder, not a 4x app-store average. RevenueHunt’s 2026 census (45M+ responses, 20,000+ stores) puts 5.5% of completers into an order. ConvertFlow’s September 2026 sample (n=2,120) puts 5.2% of quiz viewers into an order. Octane’s paid-traffic panel (500+ merchants) puts quiz landing pages at 7.1% versus product pages at 2.3%. None of those is sitewide conversion.
Merchants Google product quiz conversion rate benchmarks and get a mashup: a Shopify app promising 4x conversion, a listicle quoting 10%-25% of quiz takers, then a “2.75x the average store” claim that compares quiz takers to all visitors. Finance averages them. You ship a 12-question popup, gate the results behind email, and wonder why the catalog still leaks.
Product quiz conversion rate benchmarks matter when the shopper cannot see the whole assortment at once, and the only thing standing between a click and a cart is whether you collapse the choice. This page sits next to product page conversion rate benchmarks, landing page conversion rate benchmarks, add to cart rate by niche, and size guide conversion rate impact.
Product quiz conversion rate benchmarks are labeled purchase, completion, and engagement rates for product recommendation quizzes, each tied to a named denominator (viewer, starter, completer, paid landing page, or all-store traffic).
They are not “our quiz converts at 18%.” That sentence is missing the clock. Completer conversion is orders divided by people who reached results. Viewer conversion is orders divided by people who saw the quiz. Sitewide conversion is orders divided by sessions. Mixing those three is how a skincare brand and a furniture brand both think they are failing.
They are also not landing page conversion. Unbounce’s 6.6% median is visits to a campaign page. A quiz can be that page. Octane’s 7.1% quiz-LP cell is paid traffic to a quiz URL, which is closer to a landing-page job than to an on-site finder.
The useful name for the job is guided choice. A quiz that maps answers to a SKU, a bundle, or a routine is one rung. A lead-gen quiz that exists to fill Klaviyo is another. Mixing those rungs into one “product quizzes lift conversion 4x” slide is how you buy the wrong widget.
Wrong meters buy the wrong quiz. You celebrate completer conversion, then discover almost nobody started. Product quiz conversion rate benchmarks only matter if you name the slice of traffic, and if you score orders after the results page, not just starts.
Product quiz conversion rate benchmarks work when you name the rung (start, complete, viewer-to-order, completer-to-order, paid LP vs PDP, AOV, all-traffic holdout), refuse to average vendor before/afters, and do not compare quiz takers to the whole store as if they were the same people.
| Rung | What you measure | Labeled public anchor | Decision |
|---|---|---|---|
| 1. Start / complete | Share of starters who reach results | RevenueHunt 69% finish (31% drop) | A buried or 12-question quiz never earns the 5.5% |
| 2. Viewer-to-order | Orders / people who saw the quiz | ConvertFlow 5.2% of viewers (n=2,120) | Closest public “saw it, bought” cell |
| 3. Completer-to-order | Orders / people who finished | RevenueHunt 5.5% pooled; named categories 6.9% fragrance to ~3.6% other | This is not sitewide CVR |
| 4. Paid quiz LP vs PDP | Orders / paid landing visitors | Octane 7.1% quiz vs 2.3% PDP (500+ merchants) | Cold traffic test, not an on-site widget test |
| 5. Within-store AOV | Quiz orders vs non-quiz orders, same store | +11%-15%; ~7 in 10 stores; beauty +20% | Conversion-only tests miss the basket |
| 6. All-traffic incrementality | Quiz on vs off for every visitor | no public dataset | Do not paste 4x or 10%-25% as a planning number |
Sources: RevenueHunt 2026; ConvertFlow Sep 2026; Octane Dec 2024.
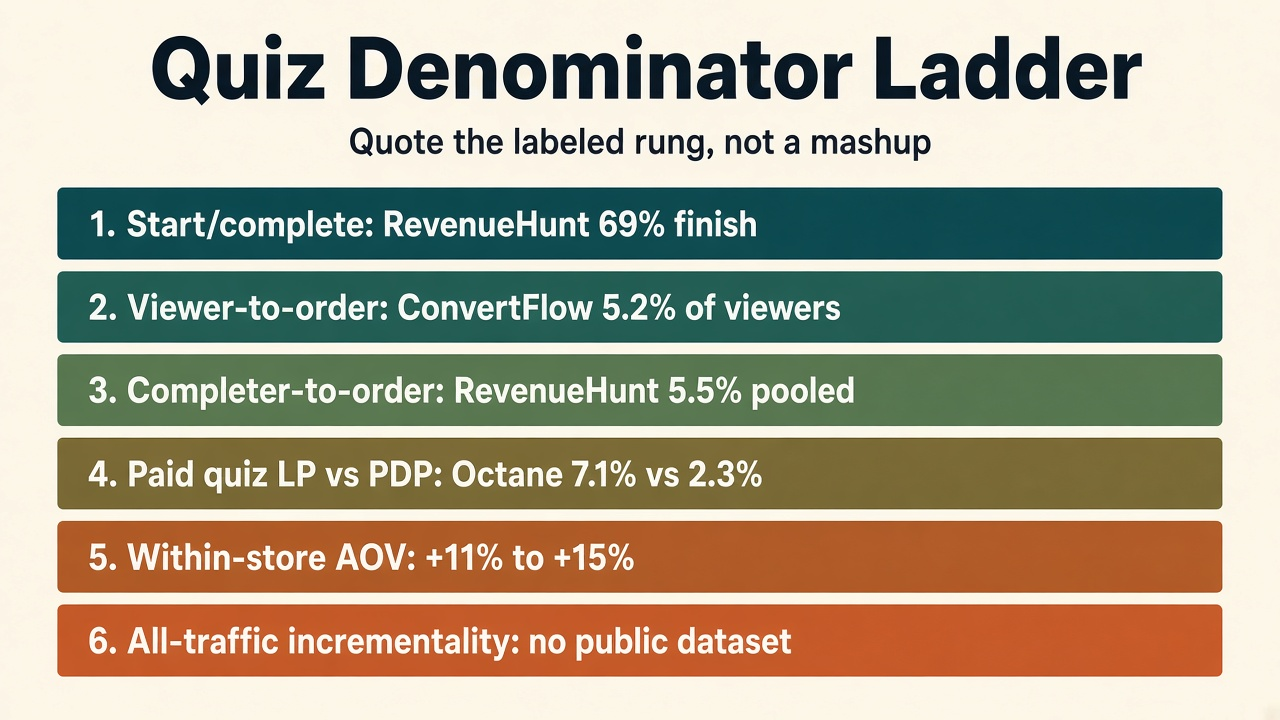
Source: RevenueHunt 2026; ConvertFlow September 2026; Octane AI December 2024. URLs in the table.
RevenueHunt’s named-category rows (generic quizzes, about 78% of responses, are excluded from those rows) spread under the 5.5% pool: fragrance 6.9% (3,989 responses), haircare 6.7% (7,980), supplements 6.2% (1,046), beauty and skincare 6.1% (16,225), coffee and tea 5% (1,725), CBD 4.3% (719), other sectors about 3.6% (4,500). The unnamed remainder drags an all-in figure toward ~4% (RevenueHunt).
A later RevenueHunt Shopify cut (1,905 Built for Shopify quizzes with at least 25 responses, last 180 days, 1,092 after one-quiz-per-store-per-industry) puts median completer conversion at skincare 8%, haircare 7%, supplements 7%, cosmetics 6%, food 6%, pets 6%, fashion 4% (RevenueHunt). Use it as a Shopify median, not as a replacement for the 45M-response pool.
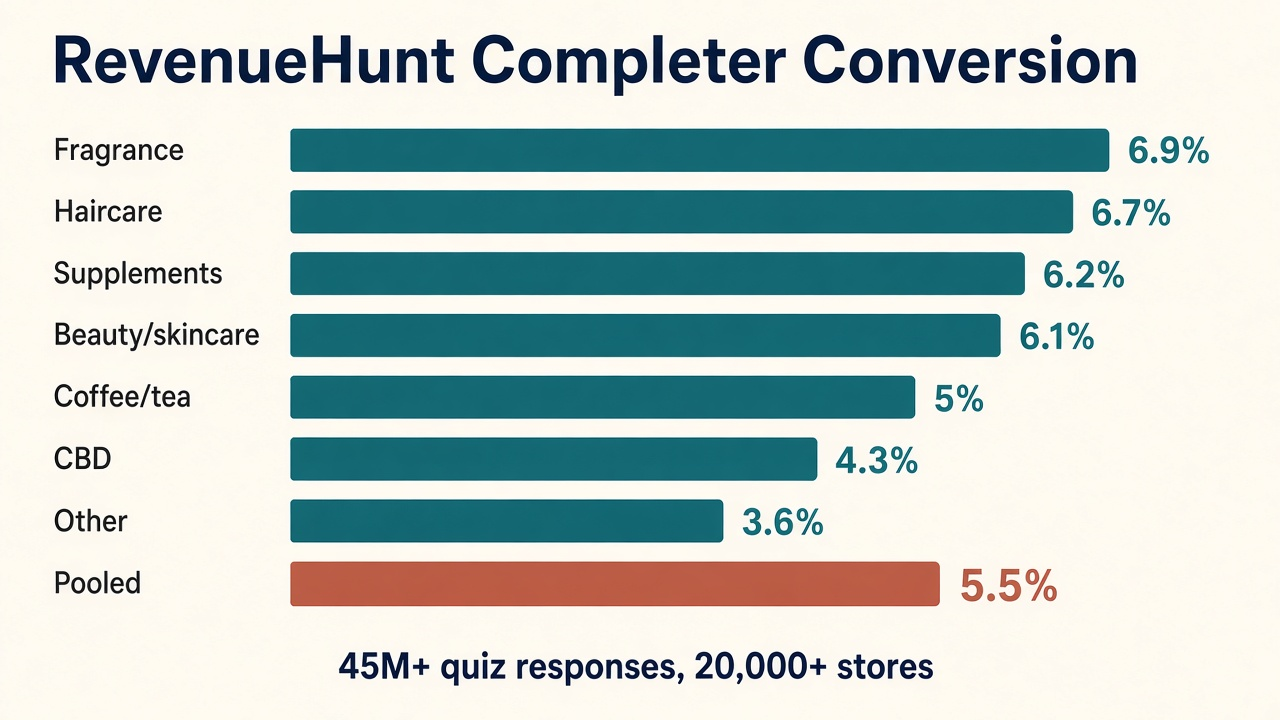
Source: RevenueHunt, The state of product recommendation quizzes: 2026 benchmark report. https://revenuehunt.com/state-of-product-recommendation-quizzes/.
ConvertFlow’s September 23, 2026 cut samples 2,120 product quiz funnel campaigns from a 200k+ database, then keeps Shopify-connected funnels live 30+ days with 100+ unique viewers and at least one attributed order. Mean order rate: 5.2% of viewers. Mean engagement: 44.2%. Mean attributed revenue per view: $9.43. Mean attributed AOV: $264 (ConvertFlow). That AOV is a ConvertFlow-connected mean, not Littledata’s Shopify median. Do not multiply it by a 1.4% session CVR.
Basket bands (medians; ConvertFlow labels some directional): under $50 AOV, 1.7% of viewers order and $0.24 revenue per view; $50-$150, 6.1% and $5.79; $150+, 3.8% and $13.49. Engagement rises with basket (15.6% / 52.1% / 60.6%). High-ticket quizzes get started more and close less on the same session. That matches RevenueHunt’s note that high-consideration sales leak off-session: 67% of first quiz-attributed orders land the same day, 88% within 7 days, 91% within 30, and about 1 in 5 after day 30 (RevenueHunt).
Octane’s December 28, 2024 post is the cleanest paid-traffic comparison in public: 500+ merchants sending ads to both a quiz page and a product page. Quiz 7.1%, PDP 2.3%, about 3x, plus 42% email opt-in versus 3% on product pages (Octane). Keep it on the landing-page rung. Octane’s homepage also prints 4x higher conversion and a 77% average start rate without the 500-merchant method. Quote the blog cell, not the homepage slogan (Octane).
Single-store Octane write-ups stay off the ladder. Doe Lashes: 79% of quiz viewers start, 4.6% of completers purchase, 11% higher AOV, 24% of revenue through the quiz. Geologie: completion-to-purchase 9% to 13% after swapping a custom quiz for Octane, 90%+ completion. Those are labeled anecdotes, not a census (Doe Lashes; Geologie).
RevenueHunt’s Shopify 180-day set splits email strategy. Gated (n=432): 76% completion, 7% conversion, $6.06 revenue per completion. Optional skippable (n=225): 85%, 9%, $7.77. No email ask (n=435): 90%, 5%, $3.99. Optional wins pooled RPC. Gating still shows up in the top third for skincare, hair, cosmetics, and supplements. Fashion, food, and pets top performers skip the gate (RevenueHunt).
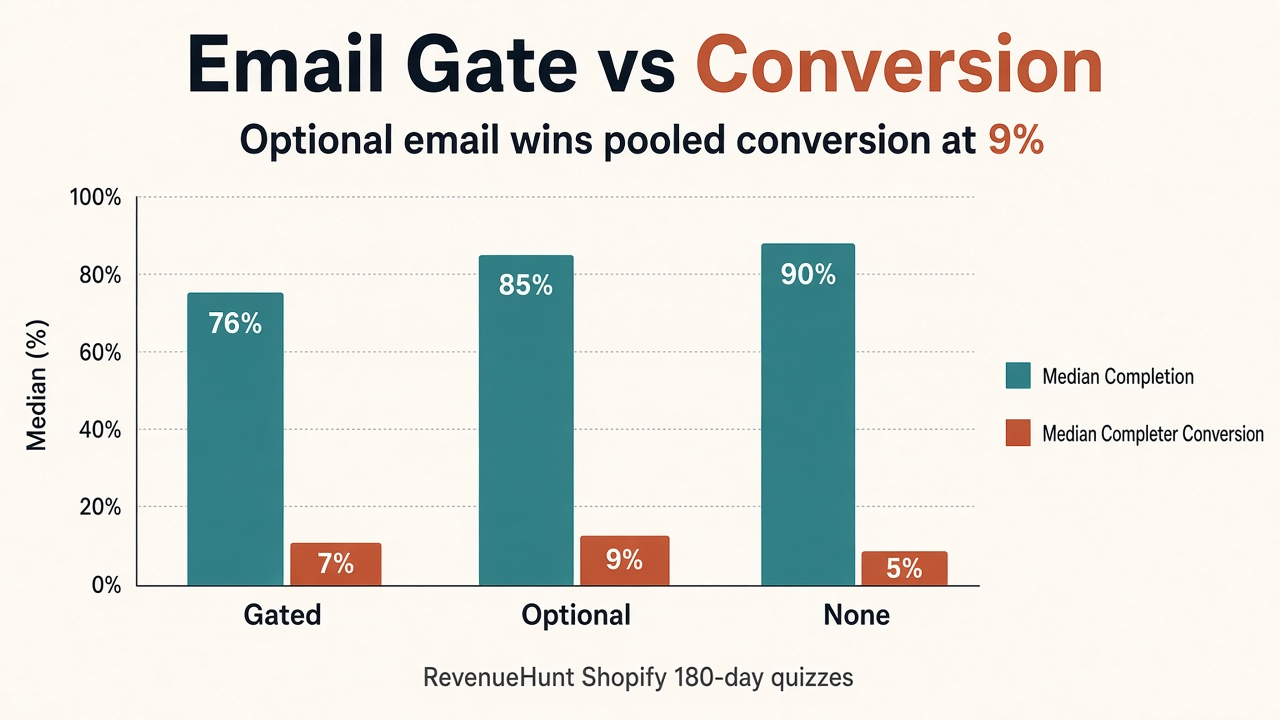
Source: RevenueHunt, Product quiz mistakes ranked by industry data. https://revenuehunt.com/quiz-creation-mistakes-that-hurt-your-ecommerce-sales/.
Reddit already talks like operators. One comment on r/shopify_growth claimed a flower-delivery catalog quiz with “Clean A/B vs no-quiz control, lift was about +14%” (r/shopify_growth). Treat that as Low-confidence anecdote. A parallel r/shopify thread said quizzes work best for recommendations, not pure lead gen, and that “the email captured after a quiz recommendation converts 2-3x better than a generic popup” (r/shopify). Medium confidence on the job, not on the multiplier.
There is no public dataset that answers “what happens to sitewide conversion when every visitor is in a quiz holdout.” Completer 5.5% and viewer 5.2% cannot substitute. If you also run a post-purchase upsell, the same rule applies: score the clock you actually started.
Test product quiz conversion as a holdout on orders and on AOV, not as a theme you ship on every SKU. Duplicate the template, put the quiz next to the catalog, and do not call the test done until the 30-day attribution tail is in. Each step is at most two sentences.
Product quiz conversion rate benchmarks collapse when the question skips the denominator. Completer rates, viewer rates, and paid landing-page rates are different jobs. The five questions below are the ones merchants actually ask, each answered in two or three sentences.
Q: What is a good product quiz conversion rate? A: Name the denominator first. RevenueHunt’s 2026 census puts 5.5% of completers into an order (45M+ responses). ConvertFlow’s September 2026 sample puts 5.2% of quiz viewers into an order (n=2,120). Neither is a sitewide Shopify conversion rate.
Q: Do product quizzes increase conversion rate? A: They can, for the slice that sees or finishes them. Octane’s paid-traffic panel (500+ merchants) shows quiz landing pages at 7.1% versus product pages at 2.3%. There is no public dataset for all-traffic incrementality across Shopify.
Q: What is the difference between quiz completion rate and quiz conversion rate? A: Completion is starters who reach results (RevenueHunt 69%). Conversion is orders on a chosen base: completers (5.5%), viewers (5.2%), or landing-page visitors (Octane 7.1%). ConvertFlow’s 44.2% “conversion” row is engagement, not purchase.
Q: How long should a Shopify product quiz be? A: RevenueHunt’s Shopify 180-day top third clusters around 5-7 questions, not a universal “keep it to three.” Optional email before results won pooled revenue per completion ($7.77 vs $6.06 gated vs $3.99 none). Fashion, food, and pets top performers skip the gate.
Q: Can I quote 4x or 10%-25% as the conversion lift from adding a product quiz? A: No. Those bands mash vendor homepages and unnamed post-results rates. Quote RevenueHunt’s 5.5% completer cell, ConvertFlow’s 5.2% viewer cell, Octane’s 7.1% vs 2.3% paid-traffic cell, or your own holdout.
Product quiz conversion rate benchmarks are a denominator stack, not a plugin percentage. Completers convert at about 5.5% in RevenueHunt’s census. Viewers convert at about 5.2% in ConvertFlow’s Shopify sample. Paid quiz pages beat product pages in Octane’s 500-merchant panel. None of that is an all-traffic holdout. Quote the labeled rung, or run the test through the 30-day tail.
If you built a catalog people will actually sell, list it on feat. so affiliates get a storefront that can collapse the choice before the click dies.
Size guide conversion rate impact is a Size Confidence Ladder: Baymard 83%/87% fail sufficiency; Snipes Fit Finder +3% all-traffic vs a static chart.
Sticky add to cart conversion lift: Vitals 9.3% of orders involve the bar; Growth Rock +7.9% desktop vs scroll-to-section with no order lift.
Exit-intent popup benchmarks: Omnisend 2025 onExit ~1.8% vs scroll 2.1%; OptiMonk cart-abandon 17.12% is a different job. Not list-growth averages.