Product Quiz Conversion Rate Benchmarks (2026)
Product quiz conversion rate benchmarks are a Quiz Denominator Ladder: RevenueHunt 5.5% of completers; ConvertFlow 5.2% of viewers. Not sitewide CVR.
Mobile vs desktop CVR gap: Littledata Sep 2026 Shopify median 1.5% both devices; top 10% still 3.9% vs 5.2%. Contentsquare 3.4% vs 2%.

TL;DR: The mobile vs desktop conversion rate gap is a Device Gap Ladder, not one “1.2% vs 1.9%” law. Littledata’s September 2026 Shopify panel (421 stores) finds median 1.5% on mobile and 1.5% on desktop, while the top 10% still sit at 3.9% vs 5.2%. Contentsquare retail figures Shopify cites put desktop at 3.4% and mobile at 2%, with mobile near 70% of traffic.
Merchants Google the mobile vs desktop conversion rate gap and get a recycled slogan. “Mobile is 1.2%. Desktop is 1.9%.” That fork still lives on decks and in our own Shopify conversion rate benchmarks as the widely quoted Littledata device story. It is not the September 2026 Littledata median.
Mobile vs desktop conversion rate gap matters when you decide whether to freeze paid spend, rebuild the theme, or accept “browse on phone, buy on laptop” as destiny. This page sits next to shopify conversion rate benchmarks, ecommerce bounce rate benchmarks, site speed conversion rate impact, and express checkout conversion rate benchmarks.
The mobile vs desktop conversion rate gap is the difference between purchase (or funnel) conversion measured on phone sessions and the same metric on desktop sessions, on a labeled panel and denominator.
It is not one KPI. Operators mash three jobs. First is a legacy Shopify device fork many decks still quote: mobile near 1.2%, desktop near 1.9%. Second is the current Shopify median: Littledata’s September 2026 panel where both device medians sit at 1.5%. Third is a retail or large-brand panel such as Contentsquare’s 3.4% vs 2%. A fourth meter is traffic share: even when device medians match, mobile can still own ~70% of sessions and therefore most of the blended rate (Littledata; Littledata traffic; Shopify).
This article owns the Device Gap Ladder. Session-purchase percentiles live in Shopify conversion rate benchmarks. Speed and bounce live on their own spokes. Do not grade Contentsquare’s 3.4% against Littledata’s 1.5% as if they share a clock.
Finance will not fund a mobile rebuild on vibes. You need labeled rungs before you promise “closing the gap unlocks X%.”
Score the gap with three labeled rungs. Quote the legacy fork, the September 2026 Littledata medians, and Contentsquare retail separately. Do not write “mobile always converts at two-thirds of desktop” as a 2026 Shopify median law.
Littledata’s September 2026 Shopify panel: overall median 1.4%; mobile and desktop medians both 1.5%; top 10% 3.9% vs 5.2%; mobile traffic share median 70%. Contentsquare via Shopify: desktop 3.4%, mobile 2%, mobile ~70% of traffic. Same job—device conversion—different clocks (Littledata; Shopify).
Do not average Littledata 1.5% with Contentsquare 3.4%. Different panels, different brands, different definitions. Use Littledata to grade typical Shopify sessions. Use Contentsquare to argue retail large-site device skew. Use your own Analytics device split to decide where you leak.
| Ladder rung | What it measures | Published figure | Source |
|---|---|---|---|
| Legacy Shopify device fork | Widely quoted older Littledata device averages | Mobile ~1.2% / desktop ~1.9% | Shopify CVR spoke |
| Sep 2026 Shopify medians | Littledata 421-store panel device medians | Mobile 1.5% / desktop 1.5% | Littledata |
| Sep 2026 top decile | Same panel, top 10% stores | Mobile 3.9% / desktop 5.2% | Littledata |
| Mobile traffic share | Share of sessions on phones | Median 70% (45%–83% middle 60%) | Littledata |
| Contentsquare retail | Desktop vs mobile purchase CVR | Desktop 3.4% / mobile 2% | Shopify |
| Universal “% of desktop” law | One gap pooling all panels | no public dataset | — |
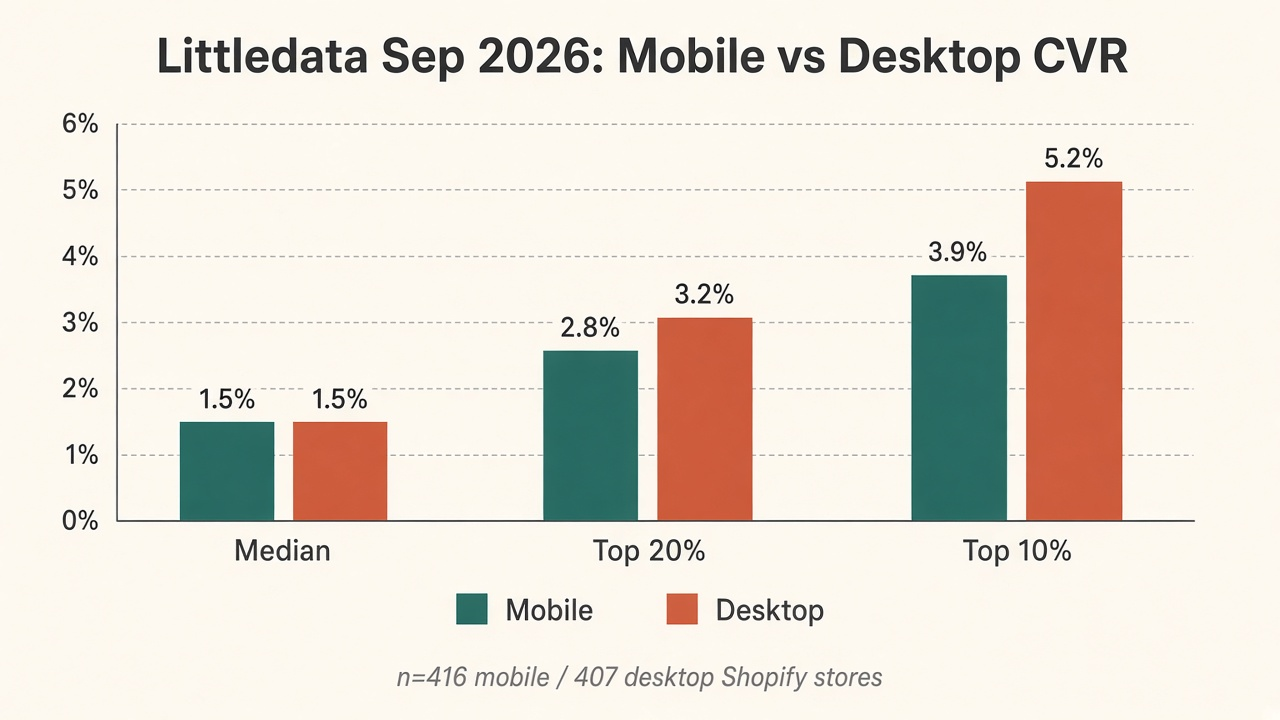
Source: Littledata, 2026. https://www.littledata.io/ecommerce-conversion-rate.
| Percentile | Mobile | Desktop |
|---|---|---|
| Bottom 10% | 0.4% | 0.2% |
| Bottom 20% | 0.6% | 0.5% |
| Median | 1.5% | 1.5% |
| Top 20% | 2.8% | 3.2% |
| Top 10% | 3.9% | 5.2% |
Source: Littledata ecommerce conversion rate page, figures generated October 2, 2026; device rows require ≥500 sessions and ≥30 orders on that device (Littledata).
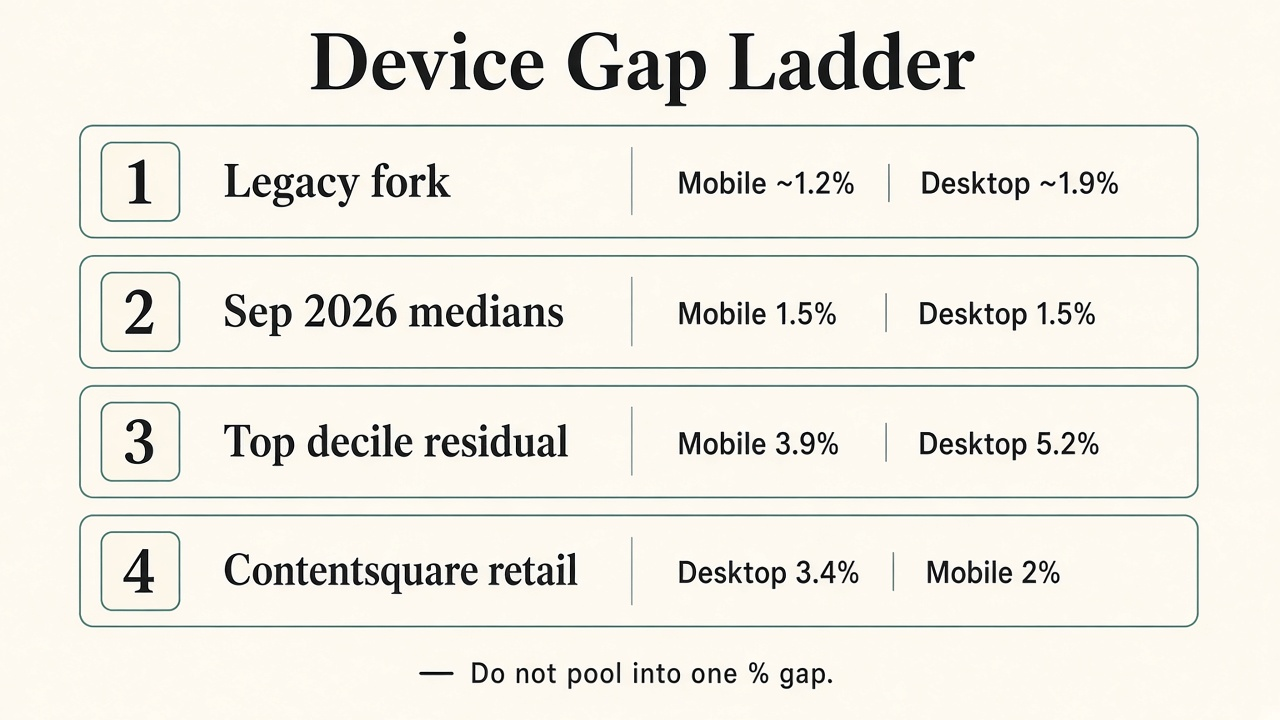
Source: Littledata, 2026; Shopify summarizing Contentsquare, 2026. https://www.littledata.io/ecommerce-conversion-rate; https://www.shopify.com/blog/mobile-vs-desktop-conversion-rates.
A closed median gap does not cancel mobile risk. On Littledata’s traffic panel, the median store still takes 70% of sessions from phones. Beauty skews higher (74%); fashion lower (65%) (Littledata). If your mobile CVR matches desktop but mobile is 80% of sessions, almost every conversion problem is a mobile problem. Pair this with bounce and speed before you blame “mobile shoppers who never buy.”
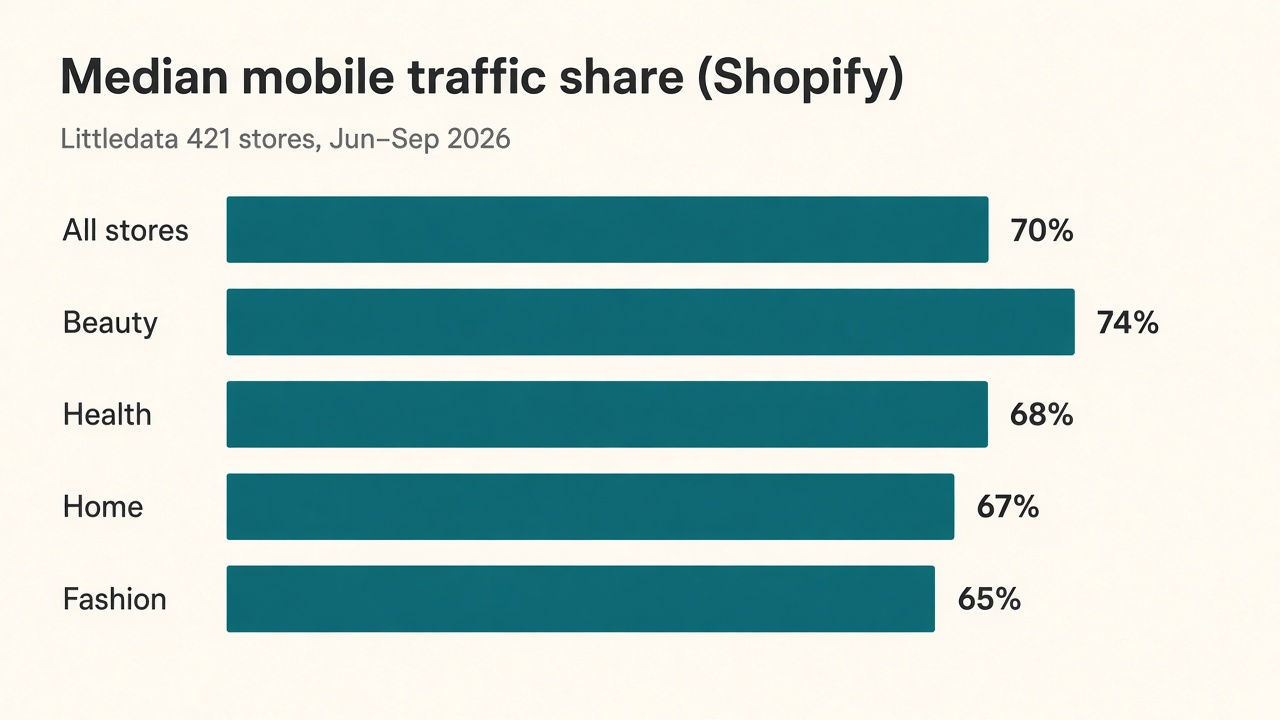
Source: Littledata, 2026. https://www.littledata.io/benchmarks/mobile-traffic-share.
The Shopify CVR spoke owns the session purchase ladder. This page owns the device gap. Express checkout and wallets are one mobile friction fix, not the whole gap (express checkout benchmarks). If ATC is fine and checkout completion is not, look at guest path, shipping transparency, and wallets before you rebuild the homepage.
Run this sequence before you buy another CRO tool. Each step is at most two sentences.
Q: What is the mobile vs desktop conversion rate gap in 2026? A: Use the Device Gap Ladder. Littledata’s September 2026 Shopify panel finds medians of 1.5% on both mobile and desktop, while the top 10% still sit at 3.9% vs 5.2%. Contentsquare retail figures Shopify cites put desktop at 3.4% and mobile at 2%.
Q: What is a good mobile ecommerce conversion rate? A: On Littledata’s Sep 2026 Shopify panel, the mobile median is 1.5%, the top 20% reach 2.8%, and the top 10% reach 3.9%. Grade your store against your own desktop row and traffic mix, not a single slogan.
Q: Did the Shopify mobile vs desktop conversion gap close? A: At the median, yes in that panel: both devices sit at 1.5%. At the top decile, no: desktop still leads 5.2% to 3.9%. Do not confuse a closed median with a closed ceiling.
Q: Why does my store still see a large mobile gap? A: Store-specific funnels often leak on mobile checkout, shipping transparency, or PDP clarity even when industry medians match. Segment ATC and checkout completion by device before you blame “browse mobile, buy desktop” as destiny.
Q: Can I average Littledata 1.5%, Contentsquare 3.4%, and the old 1.2%/1.9% into one gap? A: No. There is no public dataset that cleanly pools those denominators into one “percent of desktop” law. Quote each rung with its publisher and year, or you invent a fake industry gap.
The mobile vs desktop conversion rate gap rewards merchants who label the ladder. The sticky 1.2% / 1.9% fork is context, not the September 2026 Littledata median. That panel’s medians both sit at 1.5%, while top-decile and Contentsquare retail panels still favor desktop, and mobile still carries about 70% of sessions. The “mobile always loses by a third” slide was never a universal 2026 law.
If you want distribution that already converts attention into affiliate-sold storefronts, list on feat..
Product quiz conversion rate benchmarks are a Quiz Denominator Ladder: RevenueHunt 5.5% of completers; ConvertFlow 5.2% of viewers. Not sitewide CVR.
Size guide conversion rate impact is a Size Confidence Ladder: Baymard 83%/87% fail sufficiency; Snipes Fit Finder +3% all-traffic vs a static chart.
Sticky add to cart conversion lift: Vitals 9.3% of orders involve the bar; Growth Rock +7.9% desktop vs scroll-to-section with no order lift.