Average Cost per Content Piece by Format (2026 Ranges)
Average cost per content piece by format: WebFX ranges, freelancer modal rates, and why one national average is a myth.
Content marketing vs performance marketing: Adobe's 57% performance spend paradox, Binet and Field 60/40, and when content is brand vs activation.

TL;DR: Content marketing vs performance marketing is a job split, not a channel war. Content usually builds brand (demand and trust over quarters). Performance usually activates sales (demand that is already in market). Adobe and MMA Global find 57% of marketing budgets go to performance, while only about 19% of marketers call their org performance-led. That nearly reverses Binet and Field’s IPA 60:40 brand-to-activation guide for consumer brands.
Teams argue about content marketing vs performance marketing as if one side were virtuous and the other were a spreadsheet. The real fight is shorter: which job is this dollar buying, and which scorecard is allowed to kill it.
Content that compounds trust gets graded like a retargeting ad. Performance spend that harvests existing demand gets praised for ROAS while brand equity quietly thins. Founders feel both mistakes in CAC drift six months later.
Key takeaways:
Content marketing vs performance marketing compares two jobs inside one budget: brand building through owned stories and education, versus sales activation through paid, tracked conversion media.
Content marketing is the practice of publishing useful material (articles, videos, tools, newsletters) to attract and retain an audience that may buy later. Performance marketing is media and creative optimized for a defined conversion event in a short window, usually with a CPA, ROAS, or CPL target.
Binet and Field use cleaner language than most Slack threads: brand building conditions future preference; sales activation converts people already in market (The Long and the Short of It). Content often lives in the first job. Paid search, paid social conversion campaigns, affiliates, and retargeting live in the second. Creator hybrids sit in between (influencer marketing vs paid ads).
| Dimension | Content marketing (usually brand) | Performance marketing (activation) |
|---|---|---|
| Primary job | Build demand, trust, mental availability | Harvest in-market demand |
| Time horizon | Months to years | Days to a quarter |
| Typical KPIs | Branded search, assisted conversions, retention, share of voice | CPA, ROAS, CPL, CVR |
| Failure mode | Cut too early because last-click looks weak | Rising CAC as brand equity thins |
| Example | Pillar blog, research report, education series | Search ads, conversion social, affiliate CPS |
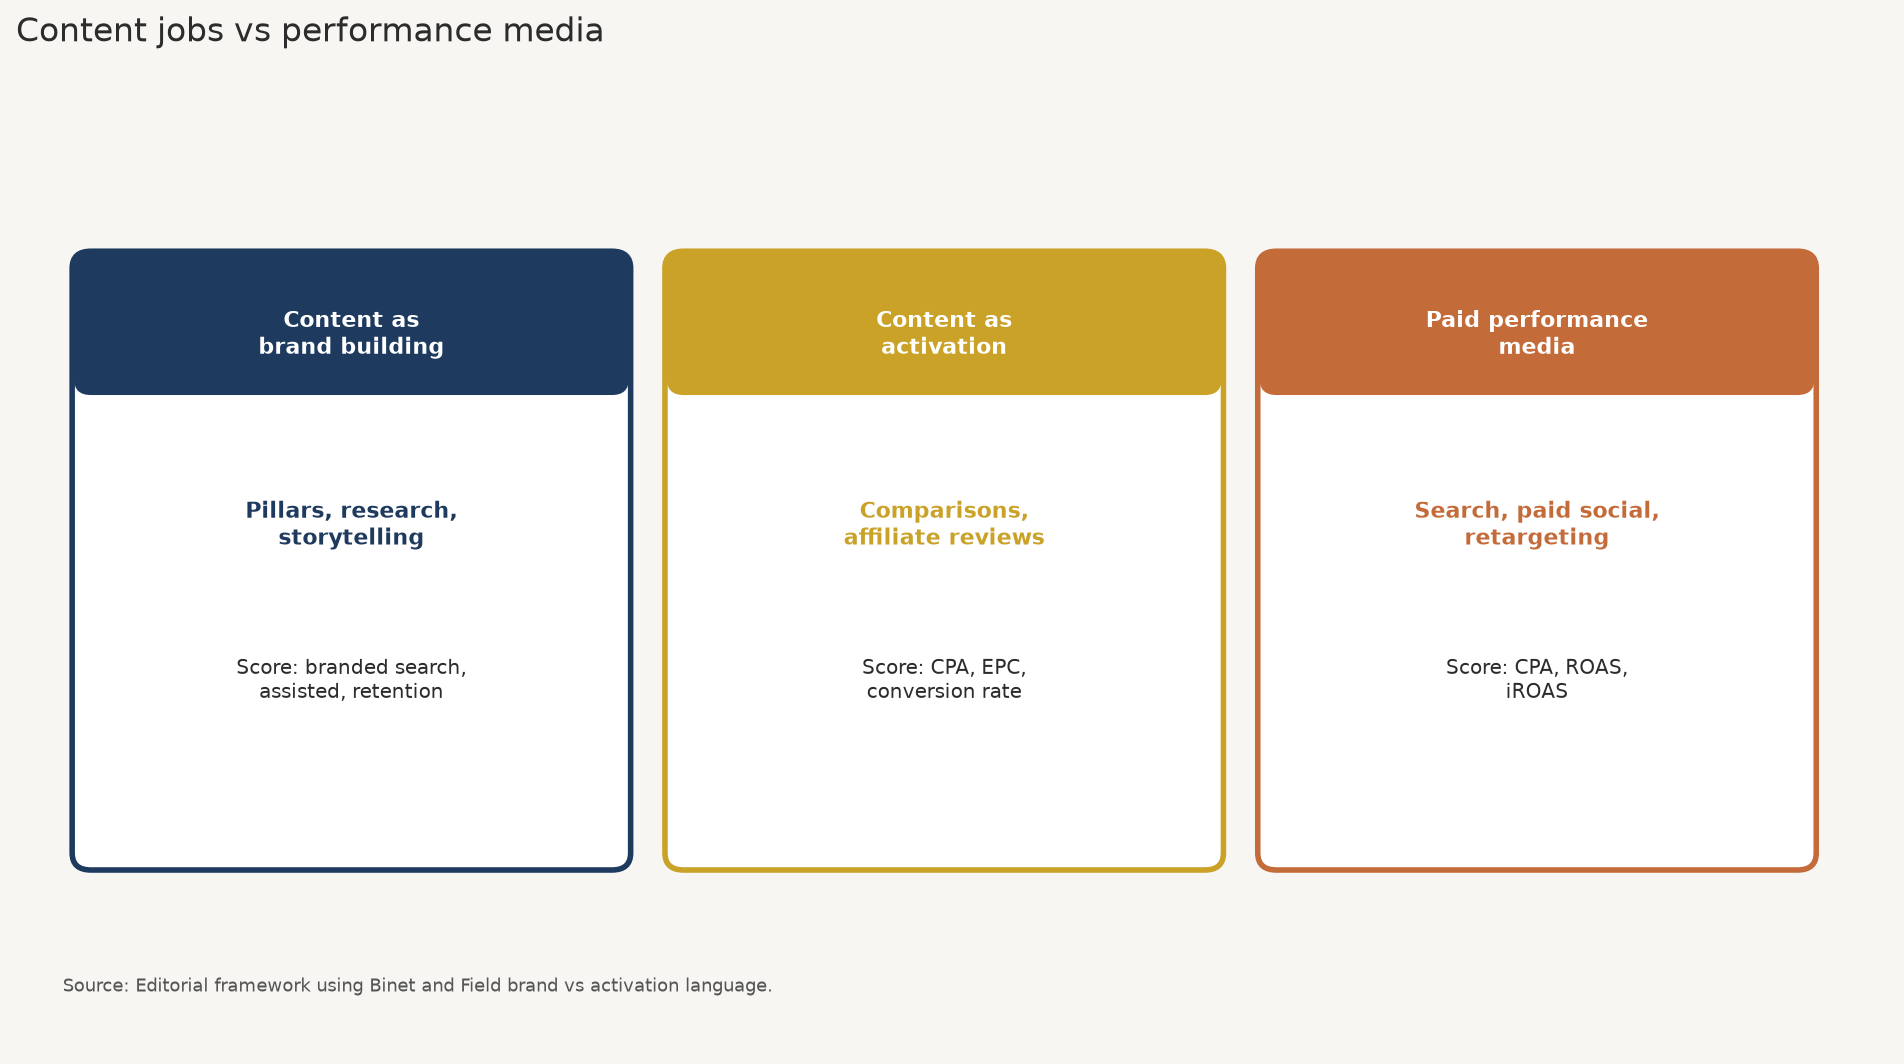
Source: Editorial framework mapping common content jobs to Binet and Field brand vs activation language. https://www.wheel.ie/sites/default/files/media/file-uploads/2021-06/the_long_and_short_of_it_pdf_doc.pdf
Wrong labels create wrong kills. A blog that moves branded search and sales-assisted pipeline gets deleted because last-click ROAS is ugly. A paid campaign that prints ROAS gets doubled until every auction competitor copies the creative and CAC doubles.
Why the comparison earns its own page:
Budgets already lean performance. Adobe × MMA put 57% of marketing budget in performance activities among 389 senior marketers (Marketing Week).
Identity does not match spend. Only about 19% call their org performance-led; 42% prefer balance/hybrid, 28% CX-led, 15% brand-led (Marketing Week).
Aspiration is balanced; process is not. About 80% intend to balance brand equity and short-term performance, yet spend still concentrates on activation (Adobe).
Cadence rewards the short term. 50% review budgets quarterly; 26% monthly; 6% weekly; 4% in real time. Only 14% review annually (Adobe / Marketing Week).
C-suite pressure is the top allocation driver for 36% of marketers (Marketing Week), ahead of customer trends (27%) and competitive activity (23%). Adobe notes the share rises to 43% inside performance-led firms.
Performance share is still rising more often than it falls. In the Adobe sample, 23% of marketers increased performance allocation in the prior year versus 7% who cut it (Adobe). That is not a temporary spike in one CFO quarter.
Complexity hides under “performance.” Adobe reports averages of four audience-targeting approaches and eight martech tools to launch and measure a single campaign. Speed without measurement depth is how teams confuse motion with proof.
The split works when you assign each dollar a job (brand or activation), pick a scorecard that matches that job, and refuse to fire brand assets with activation metrics. Content can serve either job. Most evergreen education serves brand. High-intent comparison pages and affiliate content lean activation.
Adobe and MMA Global frame a paradox: performance absorbs most of the money, yet few companies call themselves performance-led or build the strategic foundations to use that spend well. In their sample, performance share rose for 23% of marketers in the prior year, stayed flat for 70%, and fell for 7% (Adobe).
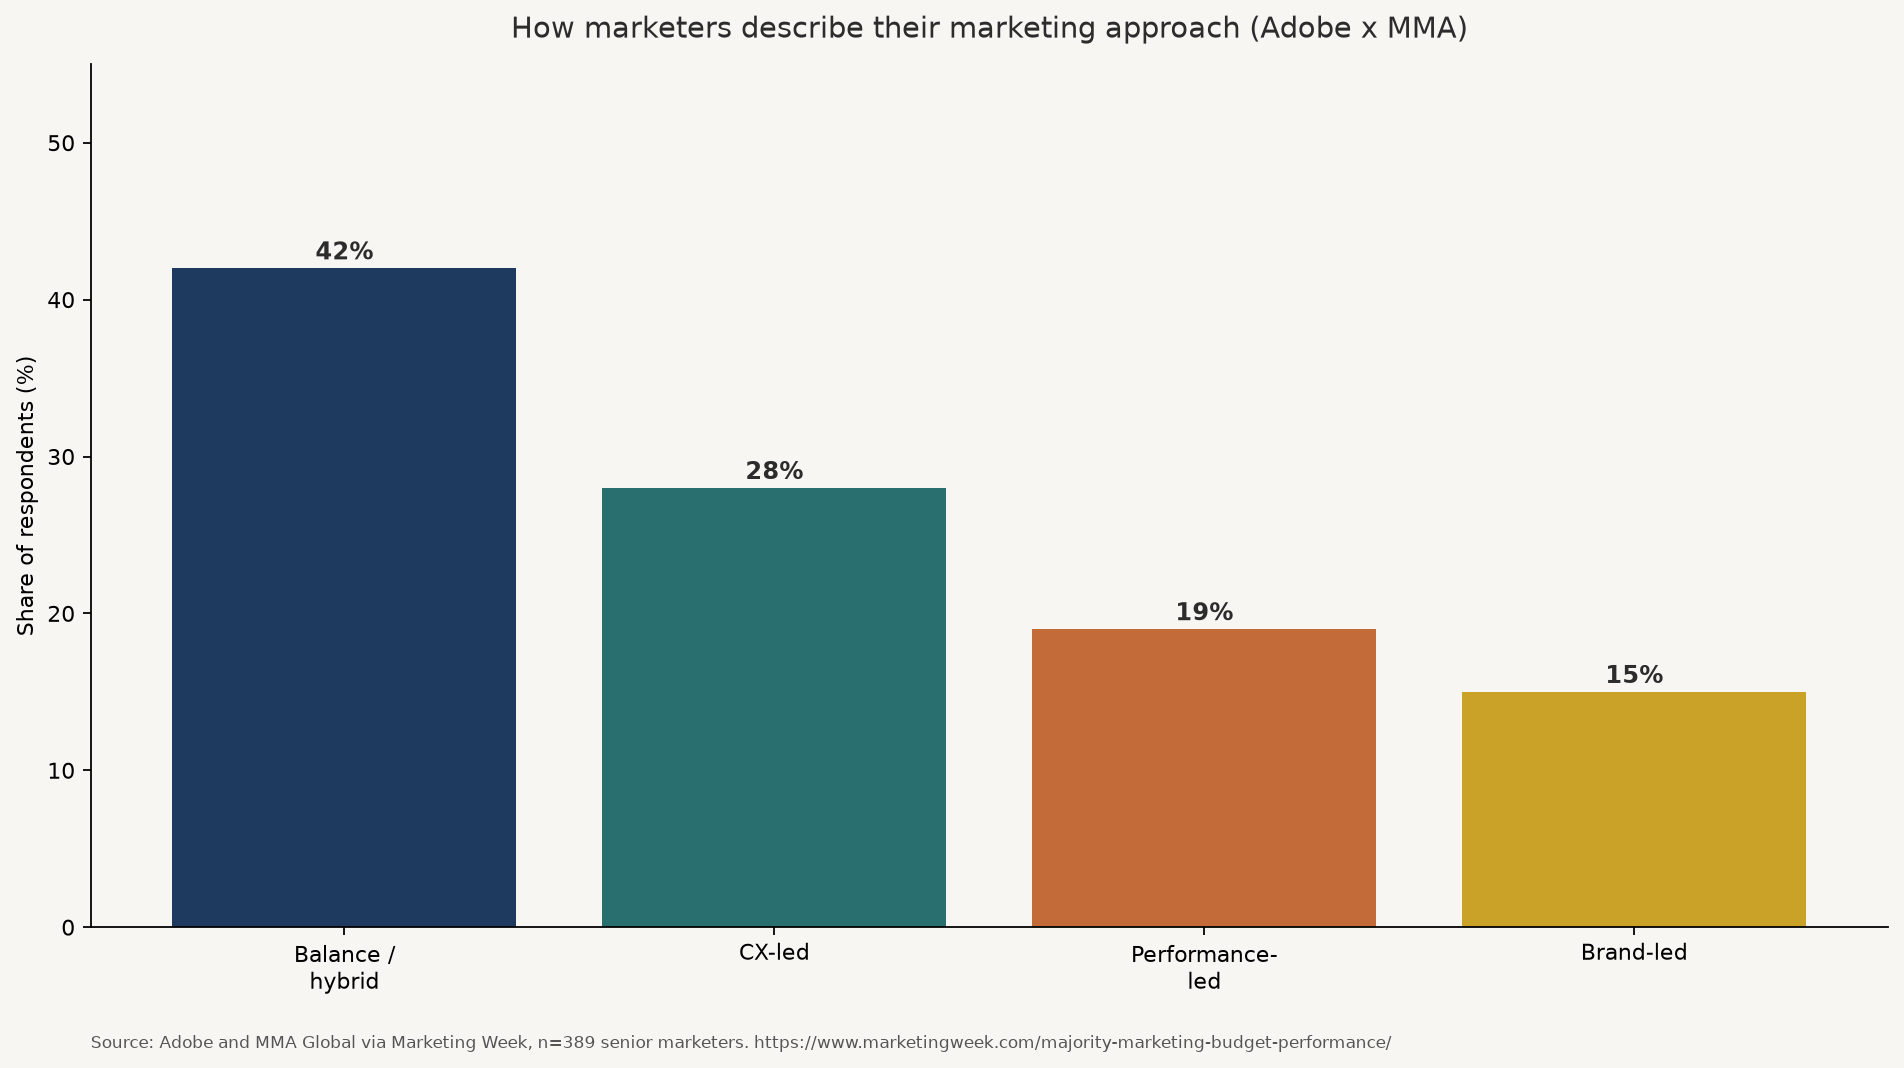
Source: Adobe and MMA Global via Marketing Week, survey of 389 senior marketers. https://www.marketingweek.com/majority-marketing-budget-performance/
That mix explains the meeting where everyone nods at “balanced growth” and then funds another retargeting pack. Content teams lose first because their payback clock does not fit monthly reviews.
Binet and Field’s IPA Databank analysis in The Long and the Short of It finds that, on average, effectiveness and efficiency peak near a 60% brand / 40% activation split for consumer brands (IPA PDF). Marketing Week correctly notes that Adobe’s 57% performance spend is close to a reversal of that guide.
For B2B, the LinkedIn B2B Institute analysis with Binet and Field puts the efficiency peak nearer 46% brand / 54% activation (LinkedIn B2B report). That is still a balance, not a 90% paid-search religion.
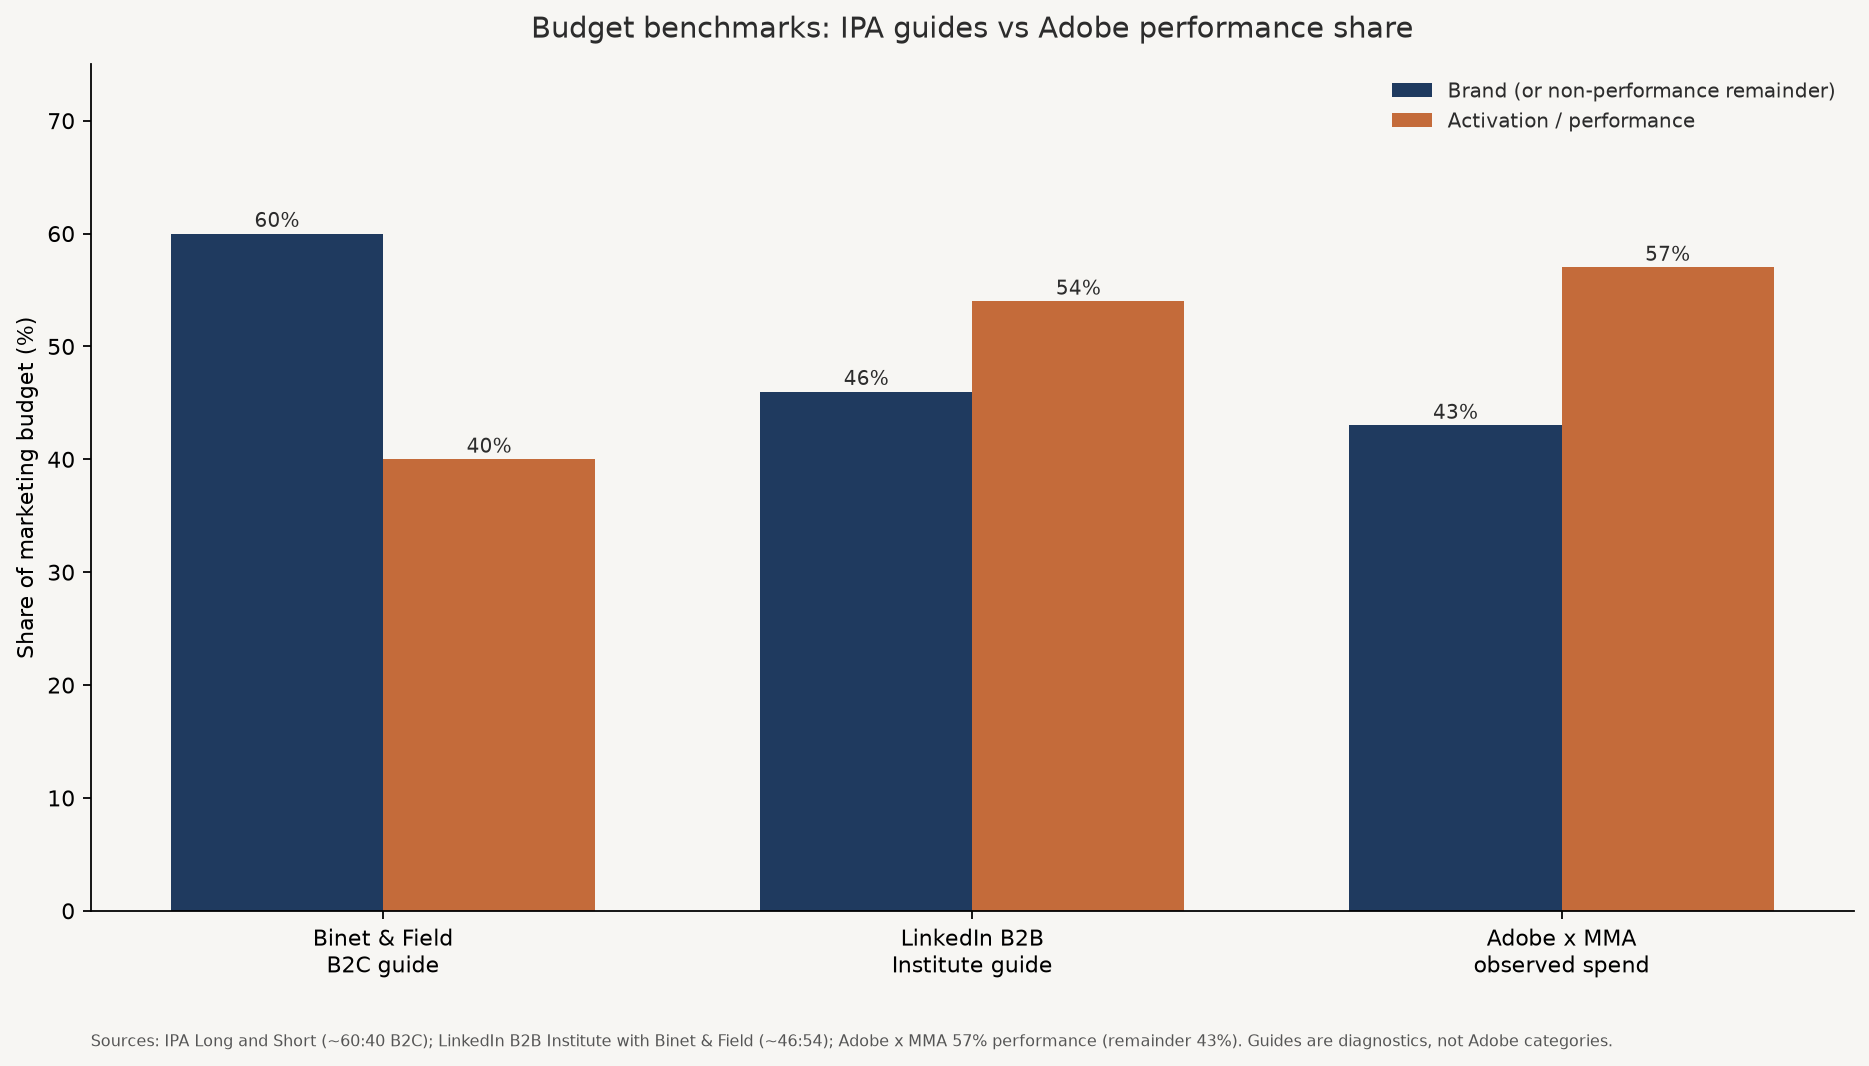
Source: Binet and Field / IPA Long and Short of It (B2C ~60:40); LinkedIn B2B Institute with Binet and Field (~46:54); Adobe × MMA Global (57% performance budget share). URLs in caption notes above.
Read these as diagnostics. Category, brand maturity, and purchase frequency move the optimum. Early-stage companies validating unit economics often run heavier activation on purpose. The mistake is treating that temporary skew as a permanent philosophy, then wondering why CAC only goes up.
| Content type | Job | Scorecard | Do not kill it for |
|---|---|---|---|
| Pillar guides, research, brand stories | Brand building | Branded search, assisted conversions, retention, share of topics | Last-click ROAS this week |
| Comparison / bottom-funnel SEO, affiliate reviews | Activation (content-shaped) | CPA/EPC, conversion rate, affiliate CVR | Vanity traffic alone |
| Product launch landing pages with paid traffic | Activation | CPA, ROAS, CAC vs LTV | Soft brand metrics alone |
| Always-on education newsletter | Brand (with light activation) | Open quality, reply rate, assisted revenue | Immediate coupon redemptions |
Orbit Media’s point still holds: content is often the cheapest brand media available, and dashboards that only show sessions will underfund it (Orbit Media). Pair content with honest attribution. Last-click attribution models starve research content. MMM and lift tests are how you defend brand dollars without storytelling theater.
Q: What is the difference between content marketing and performance marketing? A: Content marketing publishes useful material to build an audience and preference over time. Performance marketing buys media and creative optimized for a near-term tracked conversion. Content is often brand building. Performance is usually sales activation. Some content (high-intent SEO, affiliate reviews) is activation shaped like content.
Q: What is the Binet and Field 60/40 rule? A: From IPA Databank analysis in The Long and the Short of It, consumer brands on average see stronger long-run results near 60% brand-building spend and 40% sales activation. It is a diagnostic average, not a law. B2B analysis with the LinkedIn B2B Institute sits nearer 46% brand and 54% activation.
Q: How much of marketing budgets go to performance marketing today? A: In Adobe and MMA Global’s survey of 389 senior marketers, 57% of marketing budget goes to performance. About 23% of marketers increased that share in the prior year. Only about 19% describe their organization as performance-led.
Q: Is content marketing brand marketing or performance marketing? A: Usually brand. Evergreen education, research, and storytelling build mental availability and trust. Content becomes activation when it is built to convert in-market demand (comparison pages, offer pages, affiliate reviews) and is scored on CPA or EPC.
Q: Should early-stage companies ignore brand and content? A: No. They can run heavier activation while validating unit economics, but pure performance with zero brand or content investment borrows demand until CAC rises. Document the skew, set a review date, and protect a minimum brand/content floor measured on brand metrics, not weekly ROAS.
Content marketing vs performance marketing is a labeling problem that becomes a budget problem. Adobe’s Performance Paradox shows teams funding activation while claiming balance. Binet and Field show why brand and activation both belong on the plan. Put content on the brand scorecard unless the page’s real job is conversion, then defend both jobs with measurement that matches the clock.
If you built a product and want distribution that compounds through creators as well as paid activation, start at feat..
Average cost per content piece by format: WebFX ranges, freelancer modal rates, and why one national average is a myth.
Evergreen vs trending content compared with OkDork share-decay data, evergreen format odds, and a job-first mix (not a fake 70/30).
How long content takes to rank by domain authority, with Ahrefs base rates, page-age data, and why DA score calendars are mostly fiction.