Affiliate Marketing for Startups: Complete Guide
Affiliate marketing for startups is an operating system—locks, cost, recruit, rates, tracking, first 100 sales, then diagnose a flat roster.
Affiliate CVR benchmarks by niche: Skimlinks verticals run Pets 6.1% to Software 2.1%. Impact 2025 retail saw CVR fall 6% YoY as AOV rose to $123.

TL;DR: Affiliate marketing conversion rate benchmarks by niche are network averages, not universal laws. On Skimlinks programs with data, vertical average CVR runs from Pets at 6.1% down to Software at 2.1%. Impact’s 2025 retail sample saw CVR fall 6% YoY while AOV rose to $123. Judge offers with EPC, not commission % alone.
Most “affiliate conversion rate by niche” posts hand you a tidy table with no sample, no network, and no year. That is how operators fire good partners and keep bad offers.
If you need affiliate marketing conversion rate benchmarks by niche, you need three layers: a vertical ladder with a named sample, a retail journey benchmark that explains why CVR can fall while clicks rise, and a reminder that EPC (commission × basket × CVR) is the decision metric. Anything else is a motivational poster.
Key takeaways:
Affiliate marketing conversion rate benchmarks by niche are published reference ranges for the share of tracked affiliate clicks (or visits) that become a qualifying sale or action, broken out by product vertical or industry, and tied to a named sample.
“Conversion rate” here usually means click-to-sale (or click-to-qualifying-event) inside an affiliate program’s attribution rules. It is not the same as sitewide ecommerce conversion, trial-to-paid SaaS conversion, or influencer engagement rate. Window length, device mix, coupon stacking, and whether the denominator is clicks or unique visitors all move the number.
“By niche” means vertical buckets such as beauty, travel, software, or finance. Networks and analysts disagree on labels. That is why a Skimlinks-classified “Software & Technology” average is not a license to fire your SaaS affiliate at 2.0% without checking your own funnel.
These benchmarks sit beside how affiliate marketing works (the contract) and affiliate commission structures (the payout event). CVR tells you how often the event fires. Commission tells you what you pay when it does. EPC multiplies them with basket size.
Niche CVR benchmarks matter because a 2% program in software and a 2% program in pet supplies are not the same business. One may be healthy. The other may be leaving money on the table. Merchants also need a second lens: year-over-year retail CVR can fall even when demand is intact.
Why operators should care:
Secondary channel figures exist too. First Page Sage’s 2026 channel table puts Affiliate Marketing at 2.0% B2C and 1.2% B2B, assuming best practices on an agency sample averaged over a year (First Page Sage). Use that as a coarse B2C/B2B check, not as a niche census.
Benchmarks work when you name the sample, the denominator, and the decision the number is allowed to make. Vertical averages help pick and compare offers. Retail YoY benchmarks help diagnose programs. EPC decides which offer gets traffic. Last-click CVR alone will mis-rank research partners.
AvidAffiliate analyzed every Skimlinks listing as of February 2026: 28,844 programs, 9,356 with non-zero EPC, 9,323 classified into 21 verticals. Averages use non-zero values only. Treat them as network marketplace averages, not your personal traffic (AvidAffiliate).
Selected verticals by average CVR:
| Vertical | Programs (with EPC) | Avg CVR | Avg EPC | Avg basket | Avg commission |
|---|---|---|---|---|---|
| Pets | 109 | 6.1% | $0.28 | $112 | 8.1% |
| Food & Drink | 480 | 5.5% | $0.28 | $92 | 9.5% |
| Entertainment & Media | 280 | 5.5% | $0.18 | $100 | 10.8% |
| Health & Wellness | 646 | 5.4% | $0.35 | $100 | 10.6% |
| Finance & Insurance | 58 | 5.0% | $0.66 | $1,277 | 12.2% |
| Sports & Outdoors | 404 | 4.6% | $0.34 | $217 | 6.6% |
| Beauty & Skincare | 1,001 | 4.5% | $0.30 | $80 | 10.8% |
| Fashion & Apparel | 2,367 | 4.1% | $0.29 | $134 | 8.8% |
| Electronics & Computing | 664 | 3.9% | $0.29 | $228 | 8.0% |
| Travel & Accommodation | 444 | 3.5% | $0.40 | $612 | 6.4% |
| Home & Garden | 1,199 | 3.4% | $0.33 | $258 | 7.6% |
| Business & B2B | 143 | 2.9% | $0.33 | $169 | 12.6% |
| Education & Careers | 64 | 2.6% | $0.32 | $194 | 15.3% |
| Software & Technology | 142 | 2.1% | $0.22 | $69 | 31.6% |
Source: AvidAffiliate Skimlinks network analysis, February 2026. https://avidaffiliate.com/research/skimlinks-network-analysis/
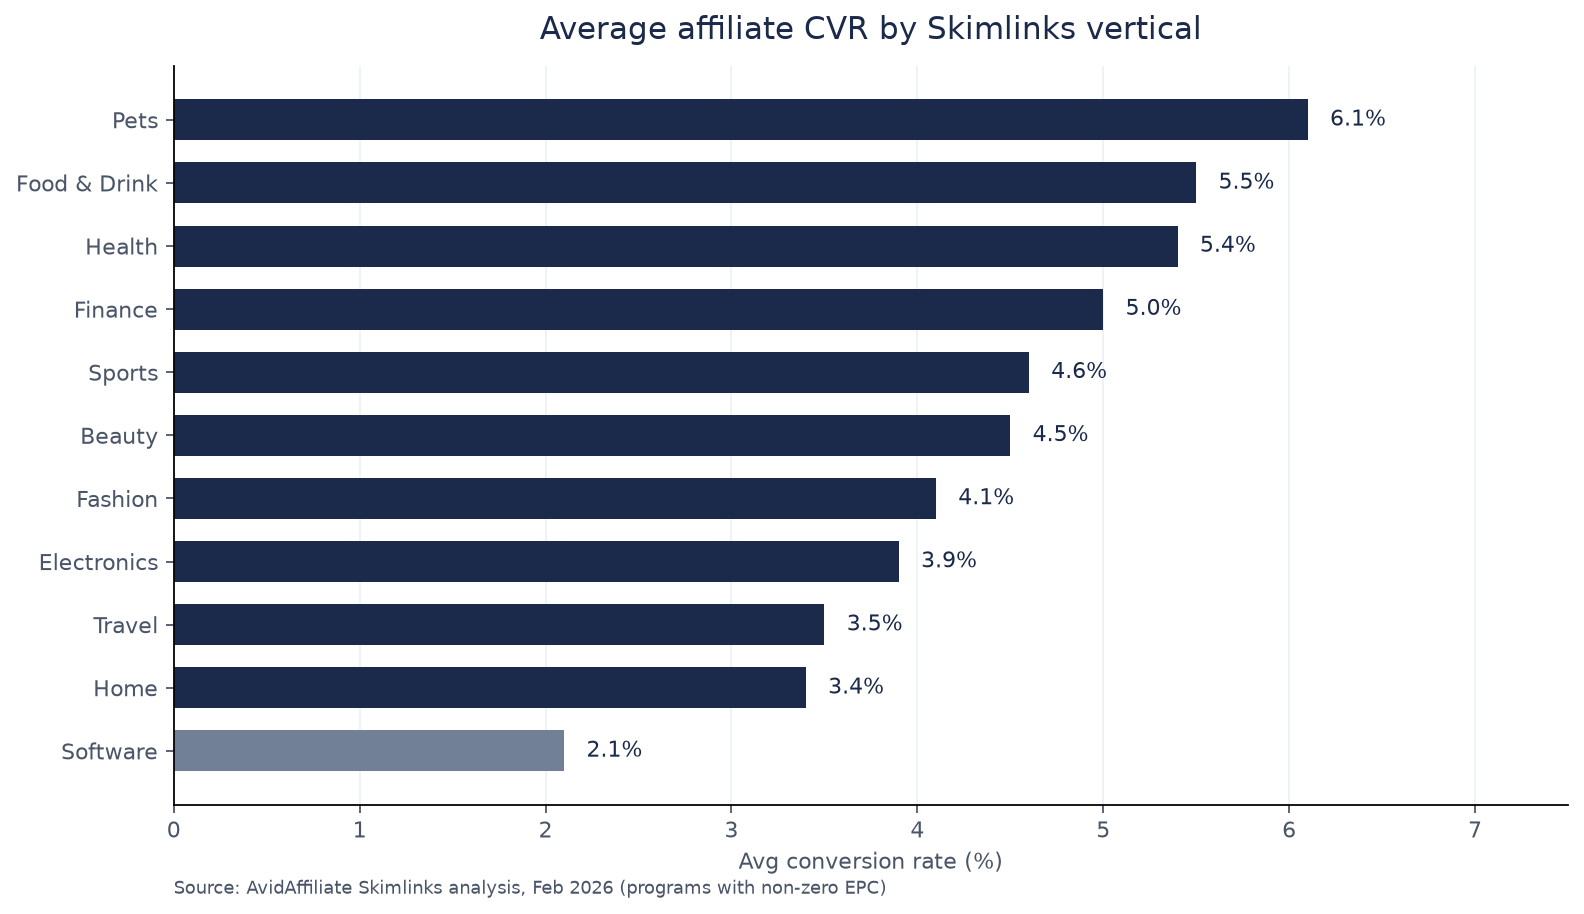
Source: AvidAffiliate, Skimlinks network analysis, February 2026. https://avidaffiliate.com/research/skimlinks-network-analysis/.
Read the ladder as relative, not absolute. Pets and food convert more often on this network’s averages. Software converts less often even when commissions look generous. Digital versus physical margin stacks still matter for what you can pay; that is covered in digital product affiliate marketing vs physical goods. CVR tells you how often the click closes.
EPC ≈ commission rate × average basket × conversion rate (for percentage CPS offers). That identity is why Software’s high commission fails the affiliate and Finance’s modest commission can win.
| Vertical | Avg commission | Avg basket | Avg CVR | Avg EPC |
|---|---|---|---|---|
| Finance & Insurance | 12.2% | $1,277 | 5.0% | $0.66 |
| Software & Technology | 31.6% | $69 | 2.1% | $0.22 |
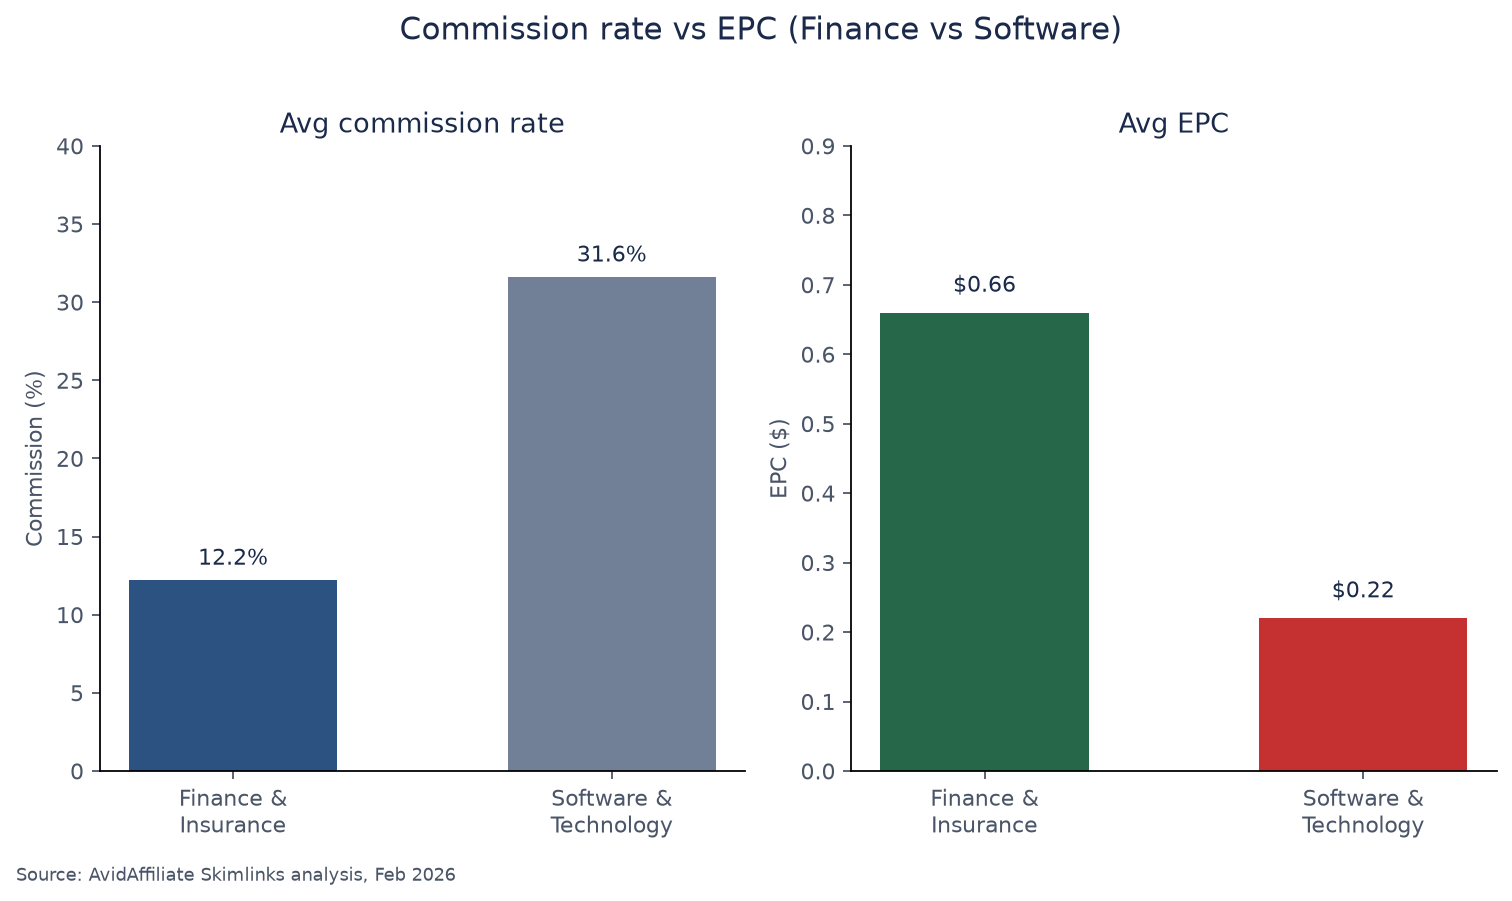
Source: AvidAffiliate, Skimlinks network analysis, February 2026. https://avidaffiliate.com/research/skimlinks-network-analysis/.
Two paths to high EPC show up across verticals: big basket with modest commission (finance, travel, jewellery) or high CVR with smaller baskets (pets, food, beauty). The trap is the middle: average commission, average basket, average CVR. That is where EPC dies quietly.
Median EPC across programs with data is $0.14. Nearly half sit under $0.10. Only 5.7% break $1.00 (AvidAffiliate). If a marketplace EPC looks too good for cold paid traffic, remember it is a blend of every affiliate’s funnel, including warm email and SEO. Your first cold campaign will usually land below the listing.
Impact.com compared 2,368 North American Retail and Shopping brands for full-year 2025 versus 2024, covering nearly 1 billion transactions (Impact.com). The headline is not a niche table. It is a journey shape.
| Metric (YoY) | Change |
|---|---|
| Clicks | +2% |
| Conversion rate | -6% |
| Transactions | -5% |
| AOV | +4% ($118 → $123) |
| Items per order | +8% (2.3 → 2.5) |
| Consumer spending | -1% |
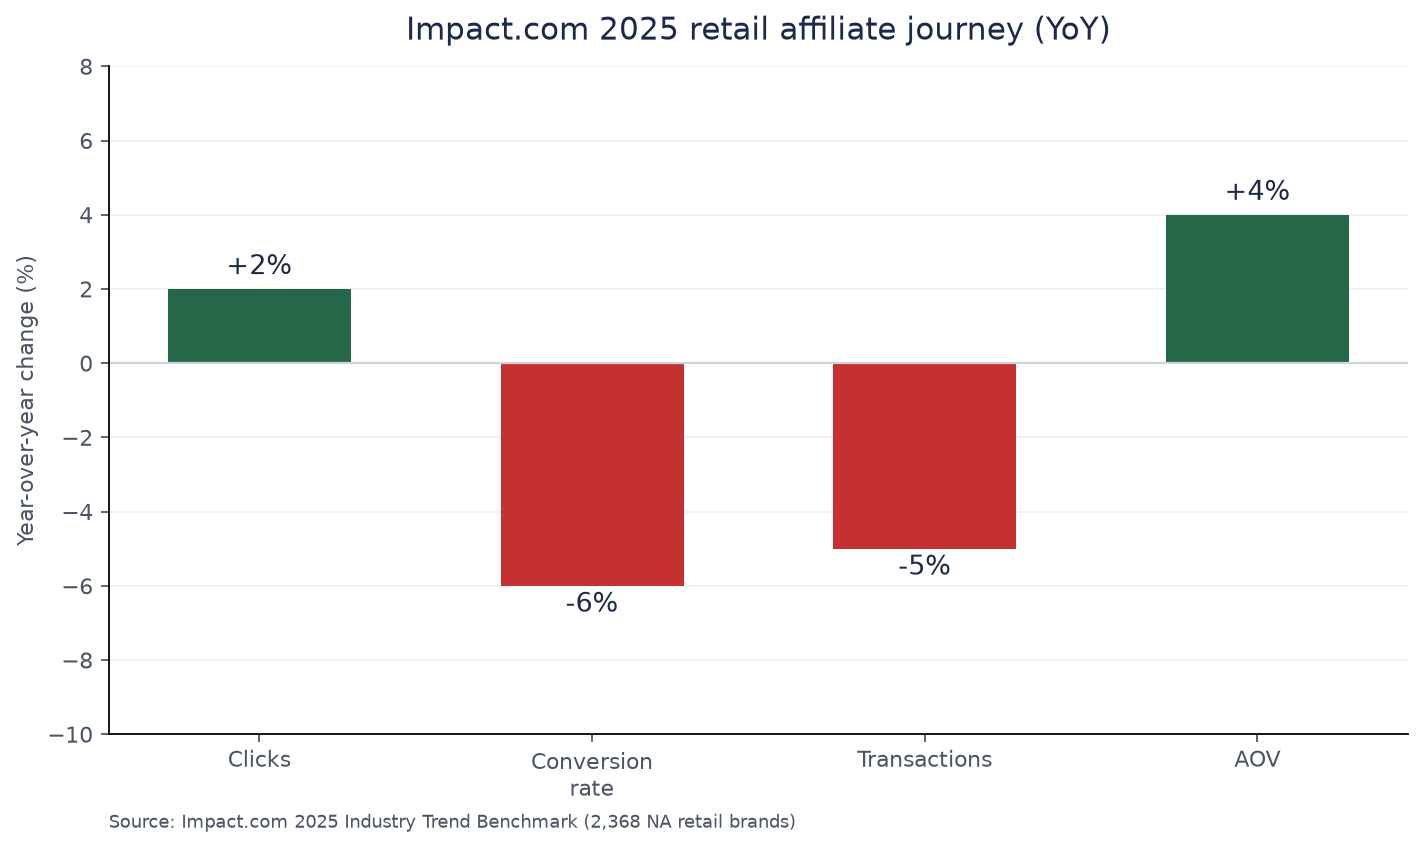
Source: Impact.com, 2025 Industry Trend Benchmark Report. https://impact.com/affiliate/affiliate-marketing-benchmark/.
Shoppers clicked more to research and comparison-shop, then bought less often but bundled more per order. November clicks surged 45% YoY while November transactions stayed roughly flat (-1% YoY). Q4 held 33% of annual clicks, up from 29% in 2024 (Impact.com).
Partner-type performance inside that sample:
If you score every partner on last-click CVR only, you will starve the research layer that feeds checkout. That is an attribution problem as much as a conversion problem.
Q: What is a good affiliate conversion rate by niche? A: On Skimlinks programs with performance data, vertical average CVRs in the AvidAffiliate analysis run from about 6.1% (Pets) to 2.1% (Software & Technology). A “good” rate is one that beats your vertical’s network average and produces an EPC that clears your traffic cost. Always name the sample.
Q: Why did affiliate conversion rates fall in 2025 if clicks rose? A: Impact.com’s retail benchmark found clicks +2% YoY and conversion rates -6% YoY as shoppers researched longer and bought in fewer, larger orders (AOV $118 → $123). That can be journey compression, not a broken offer. Diagnose before you cut partners.
Q: Should I optimize for conversion rate or EPC? A: Optimize for EPC when choosing offers, because EPC folds commission, basket, and CVR into one dollar-per-click number. Use niche CVR to set expectations and spot funnel bugs. Finance’s lower commission still beats Software’s higher commission on average EPC in the Skimlinks scrape.
Q: Are B2B and B2C affiliate conversion rates different? A: First Page Sage’s channel benchmarks put Affiliate Marketing at 2.0% B2C and 1.2% B2B under best-practice assumptions on their agency sample. That is not a niche table. Skimlinks’ Business & B2B vertical averaged 2.9% CVR among programs with data, which is a different methodology and network.
Q: Is there one official affiliate CVR benchmark for every niche? A: No. There is no public dataset that standardizes CVR across all networks and niches with identical windows and event definitions. Use Impact for retail journey YoY, Skimlinks vertical averages for relative niche ranking, and your own tracked EPC for decisions.
Affiliate marketing conversion rate benchmarks by niche are useful when they carry a sample label. Skimlinks vertical averages put Pets near 6.1% CVR and Software near 2.1%, while Impact’s 2025 retail data shows CVR can fall 6% YoY even as AOV climbs to $123. Pick offers with EPC. Diagnose programs with journey context. Ignore unsourced tables.
If you want a tracked co-branded path to sell other merchants’ products, browse the feat. marketplace.
Affiliate marketing for startups is an operating system—locks, cost, recruit, rates, tracking, first 100 sales, then diagnose a flat roster.
How to track affiliate sales: pick link cookie, coupon, pixel, S2S postback, or storefront checkout—then match Rewardful, Tapfiliate, or Impact.
Best affiliate programs for SaaS companies pass the Recurring Cap Test: labeled duration, cookie, seat type, payout rails—plus Rewardful’s ~24% planning band.