How iOS Privacy Changes Affected Performance Marketing
How iOS privacy changes affected performance marketing: ATT cut conversion CTR ~37% in research, hurt Meta-heavy Shopify sales, forced MMM and lift tests.
Performance marketing KPI benchmarks by channel: WordStream search, Triple Whale Meta 1.88 vs Google 3.27 ROAS, Dreamdata LinkedIn 121%.

TL;DR: Performance marketing KPI benchmarks by channel only work when the unit matches the job. Use WordStream/LocaliQ search medians (CTR 6.64%, CPC $5.42, CVR 8.18%, CPL $66.69) for lead harvest. Use Triple Whale ecommerce medians for purchase ROAS (Meta 1.88 vs Google 3.27). Use Dreamdata’s B2B company-level ROAS for LinkedIn (121%) versus Google Search (67%) and Meta (51%). Do not blend those tables into one “good CTR.”
Founders ask for performance marketing KPI benchmarks by channel, then paste one agency table into a board deck. Search lead conversion sits next to Meta purchase conversion. LinkedIn CPC looks “expensive” beside Meta CPC. Someone declares the account broken because CTR is not 2% everywhere.
That is not benchmarking. That is unit fraud.
The fix is three scorecards with primary samples: search harvest (WordStream / LocaliQ medians across 13,474 US search campaigns), ecommerce purchase (Triple Whale Meta and Google medians), and B2B company-level return (Dreamdata’s attributed ROAS). Pick the scorecard that matches the job, then judge your account against that grammar. Attribution and incrementality still sit on top when you scale (attribution models compared; incrementality testing explained).
Key takeaways:
Performance marketing KPI benchmarks by channel are published medians (or carefully labeled averages) for cost and efficiency metrics, scoped to a channel, objective, and sample, so you can tell whether your paid account is ahead of peers or burning cash.
They are not a single “good CTR” number. They are not a substitute for break-even ROAS from your own margin. They are not proof of incrementality. In-platform ROAS can look healthy while MER and lift tests disagree (marketing mix modeling basics).
The useful definition has three parts: the metric (CTR, CPC, CVR, CPL, CPA, ROAS, MER), the channel and objective (Search lead vs Meta purchase vs LinkedIn company influence), and the sample (who was measured, when, and whether the figure is a median). Drop any part and the benchmark becomes marketing cosplay.
Wrong units create wrong cuts. You kill Meta because ROAS sits under Google Search. You overfund cheap Meta clicks in B2B because CPC looks better than LinkedIn. You celebrate search CTR while CPL quietly rises.
Why this page earns space:
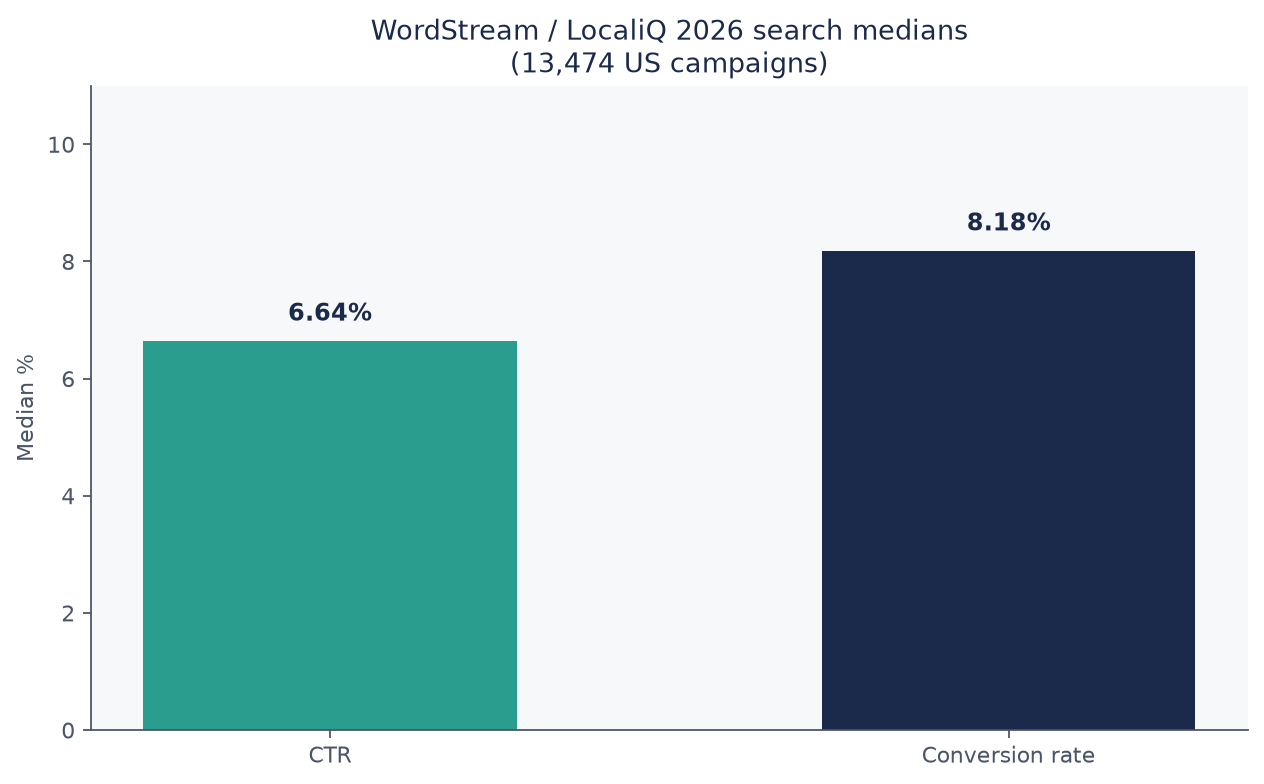
Source: WordStream / LocaliQ, 2026 Google Ads Benchmarks (13,474 US search campaigns, Apr 1, 2025-Mar 31, 2026; published averages are medians). https://www.wordstream.com/blog/2026-google-ads-benchmarks
Channel KPIs work when you read three separate scorecards, never one blended CTR table. Start with the job (harvest intent, create demand, or influence a buying committee). Then pick the primary sample that measures that job. Then set floors from medians and ceilings from your margin math.
Use this when the conversion event is a lead, quote, or other defined search conversion, not a Shopify purchase in an ecommerce panel.
| Metric | 2026 all-industry median | What it answers |
|---|---|---|
| CTR | 6.64% | Relevance on the results page |
| CPC | $5.42 | Auction cost per click |
| Conversion rate | 8.18% | Click-to-conversion quality |
| Cost per lead | $66.69 | Money metric (CPC ÷ CVR shape) |
Source: WordStream 2026 Google Ads Benchmarks. Sample: 13,474 US-based search campaigns, Apr 1, 2025-Mar 31, 2026. WordStream states that published “averages” are medians.
Industry spread matters more than the all-industry row. Arts and Entertainment CTR sits near 12.75% in that report; Automotive Repair conversion rate sits near 15.51%; Finance and Insurance conversion rate sits near 2.64%. Compare to your vertical first.
Use this when you sell products and care about attributed purchase revenue versus spend. Do not paste WordStream lead CVR into this scorecard.
| Channel | Median ROAS | Median CPA | Median CVR | Median CTR | Sample window |
|---|---|---|---|---|---|
| Meta (FB/IG) | 1.88 | $38.99 | 1.53% | 2.39% | Aug 2025-Jul 2026; 40,000+ brands |
| Google Ads | 3.27 | $28.14 | 3.11% | 1.65% | Aug 2025-Jul 2026; 21,000+ brands |
Sources: Triple Whale Facebook Ad Benchmarks; Triple Whale Google Ads Benchmarks.
In the same Triple Whale brand mix, Meta took 66.88% of ad spend and Google 22.50%. Higher Google ROAS does not automatically mean “move everything to Google.” It often means Google is harvesting demand Meta helped create. Prove that with incrementality testing before you cut the create channel.
Break-even ROAS still beats peer ROAS. If gross margin is 50%, break-even is roughly 2.0x before contribution profit. A Meta account at 1.88 can be healthy for high-margin digital goods and lethal for thin-margin physical SKUs.
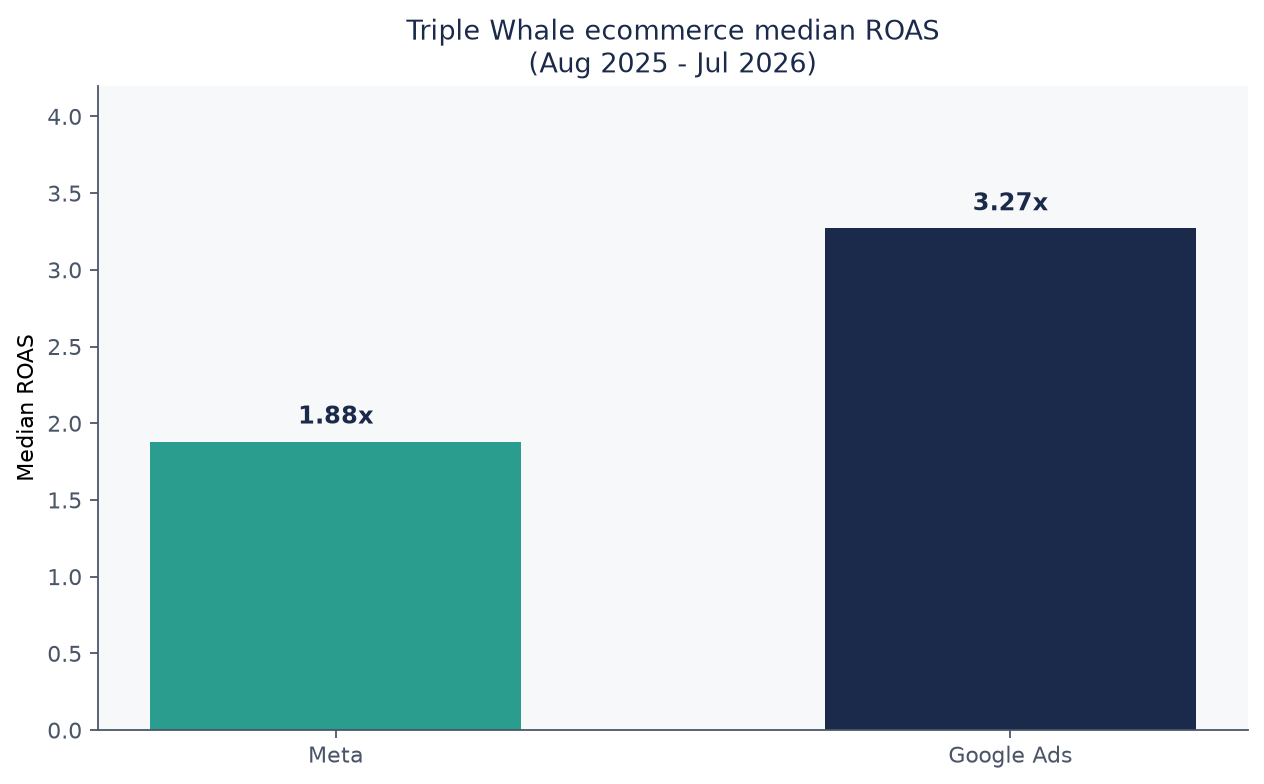
Source: Triple Whale, Facebook Ad Benchmarks (updated Aug 18, 2026) and Google Ads Benchmarks (updated Aug 20, 2026); Aug 1, 2025-Jul 31, 2026. https://www.triplewhale.com/blog/facebook-ads-benchmarks ; https://www.triplewhale.com/blog/google-ads-benchmarks
Use this when you sell to committees and close revenue in a CRM months after the first click. Monthly last-click ROAS will under-credit early influence.
Dreamdata’s 2026 LinkedIn Ads Benchmarks Report (2025 observations) aggregates thousands of B2B companies across 66M+ sessions and 3.5M+ customer journeys. ROAS uses a data-driven attribution model on closed-won deals over 12 months; impressions are excluded (Dreamdata).
| Channel | Attributed ROAS (Dreamdata model) | CPC (same report) | Cost per company influenced |
|---|---|---|---|
| 121% | €5.98 | €70.11 | |
| Google Search | 67% | (higher non-branded pressure noted) | €110.37 |
| Meta | 51% | €1.60 | €128.70 |
LinkedIn held 41% of total B2B ad budgets in that sample. Dreamdata also reports that 81% of the B2B journey now sits outside the sales pipeline, with about 88 touchpoints across 4 channels and 10 stakeholders. If your KPI review still asks “what revenue did last month’s LinkedIn spend create this month,” you are measuring the wrong clock.
Top-quartile Dreamdata customers (≤75th percentile in their cut) show LinkedIn ROAS at 279%, with Meta 133% and Google Search 138%. Treat those as distribution, not your mandatory target.
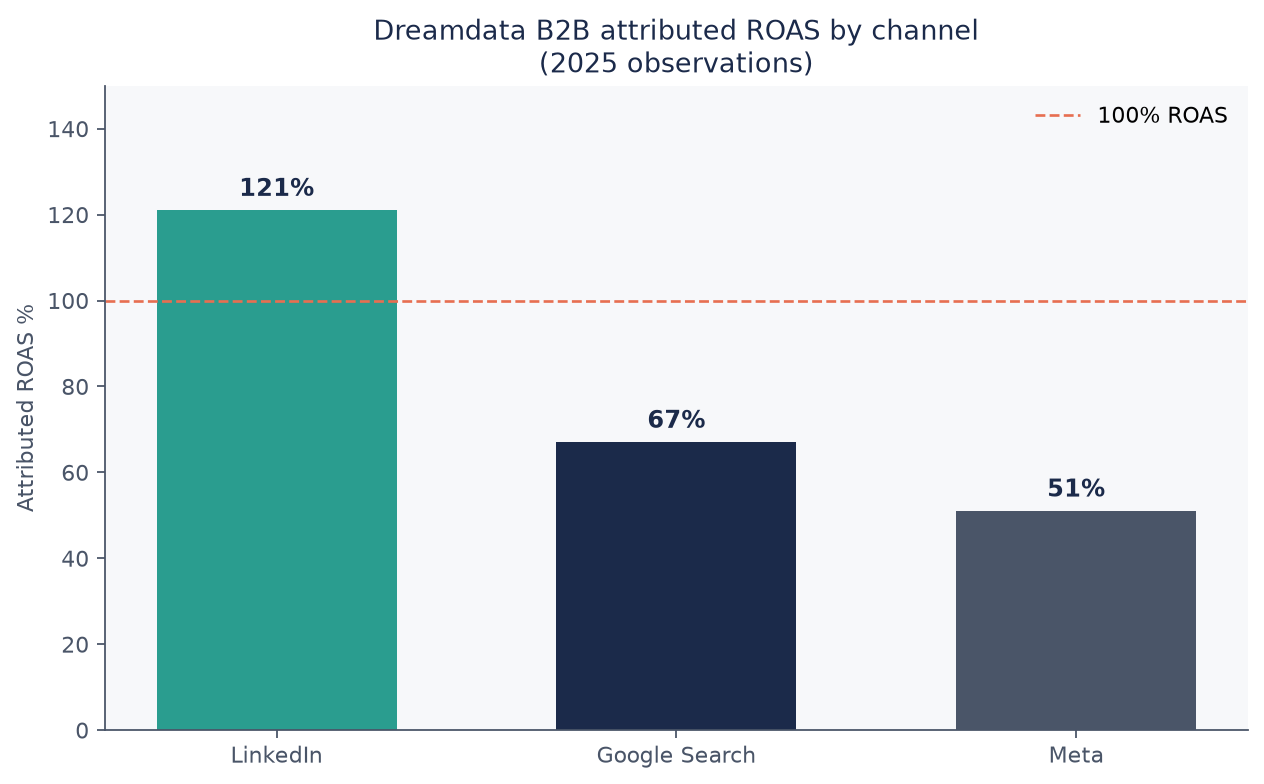
Source: Dreamdata, LinkedIn Ads Benchmarks Report 2026 (announced Mar 10, 2026; 2025 observations). https://dreamdata.io/blog/announcing-linkedin-ads-benchmarks-report-2026
| If your constraint is… | Primary scorecard | Headline peer numbers | Common mistake |
|---|---|---|---|
| Local/service lead gen on Search | A: WordStream search | CPL ~$66.69; CVR ~8.18% | Judging Search with Meta purchase CVR |
| DTC ecommerce purchases | B: Triple Whale | Meta ROAS 1.88; Google ROAS 3.27 | One ROAS target across create and harvest |
| B2B pipeline and closed-won | C: Dreamdata | LinkedIn ROAS 121%; company cost €70.11 | Optimizing only for cheap Meta CPC |
| Brand vs performance mix | Separate article | Adobe/Binet framing | Using channel CTR to settle brand spend (content marketing vs performance marketing) |
Setting channel KPI benchmarks without lying to yourself means naming the job, locking the unit, picking a peer sample, computing break-even, then reviewing platform ROAS as one input beside MER and lift. Skip the mashup table.
no public dataset, the chart does not ship.Q: What are good performance marketing KPI benchmarks by channel in 2026? A: Use three floors, not one. WordStream search medians put CTR near 6.64%, CPC near $5.42, CVR near 8.18%, and CPL near $66.69. Triple Whale ecommerce medians put Meta ROAS near 1.88 and Google ROAS near 3.27. Dreamdata B2B attributed ROAS puts LinkedIn near 121% versus Google Search 67% and Meta 51%.
Q: What is a good Meta ROAS for ecommerce? A: Triple Whale’s Aug 2025-Jul 2026 sample of 40,000+ brands puts median Meta ROAS at 1.88. “Good” still means above your break-even ROAS from gross margin, with enough room for contribution profit and repeat purchase. Vertical medians vary; Media and Publishing sits near the bottom of that report’s ladder.
Q: Why is Google Ads ROAS usually higher than Meta in ecommerce data? A: Google more often captures existing demand. Meta more often creates it. In Triple Whale’s same window, Google median ROAS is 3.27 versus Meta 1.88, while Meta still takes most spend (about 66.88% in that brand mix). Judge create and harvest on separate scorecards, then test incrementality before reallocating.
Q: Is LinkedIn too expensive if CPC is near €6? A: Not if you close companies. Dreamdata shows LinkedIn CPC near €5.98 versus Meta €1.60, but cost per company influenced near €70.11 versus Meta €128.70, with LinkedIn attributed ROAS at 121%. Optimize for company influence and closed-won, not cheapest click.
Q: Can I use one CTR target across Google, Meta, and LinkedIn? A: No. WordStream search CTR medians near 6.64% are not comparable to Triple Whale Meta CTR near 2.39% or typical LinkedIn CTRs under 1%. Different auctions, placements, and objectives. Blended CTR targets create fake underperformance.
Performance marketing KPI benchmarks by channel are a grammar problem before they are a math problem. Search lead medians, ecommerce purchase ROAS, and B2B company-level ROAS answer different questions. Use WordStream for harvest, Triple Whale for DTC purchase efficiency, and Dreamdata when committees and CRM revenue define the win. Then let margin, payback, and lift tests decide whether median is enough.
If you build products and want affiliates to sell them through co-branded storefronts with a revenue split on every sale, start at feat..
How iOS privacy changes affected performance marketing: ATT cut conversion CTR ~37% in research, hurt Meta-heavy Shopify sales, forced MMM and lift tests.
CAC vs LTV benchmarks by industry: Skok's 3:1 floor, Aleph's 4.1x SaaS median, First Page Sage industry ratios, and why payback months matter.
Affiliate marketing for startups is an operating system—locks, cost, recruit, rates, tracking, first 100 sales, then diagnose a flat roster.