Affiliate Marketing for Startups: Complete Guide
Affiliate marketing for startups is an operating system—locks, cost, recruit, rates, tracking, first 100 sales, then diagnose a flat roster.
Measure brand marketing ROI with Brand Lift, share of search, nested MMM, and geo tests, not last-click ROAS.

TL;DR: Brand marketing ROI measurement is triangulation, not a ROAS cell. Nielsen finds 85% of marketers feel confident measuring ROI while only 32% measure holistically across traditional and digital. Pair Brand Lift, share of search, nested MMM, and geo experiments so carryover value (Google: months 5-24 often matches the first four months) shows up before finance cuts the brand line.
Finance asks for brand marketing ROI measurement. Dashboards answer with last-click ROAS. Those are different jobs, and treating them as the same is how brand budgets die in quarterly reviews before carryover shows up. The fix is a practical stack: Brand Lift, share of search, nested MMM, and geo tests on one commercial question.
Brand marketing ROI measurement means proving that equity-building spend created incremental commercial value on a clock longer than a click window. It is not the same question as content versus performance budget labels, though Adobe’s 57% performance-share paradox explains why the scorecard broke. Pair this with marketing mix modeling basics, incrementality testing, and attribution model limits.
Brand marketing ROI measurement is the practice of estimating incremental commercial return from equity-building activity using triangulated methods (models, experiments, brand KPIs, and execution metrics), not a single last-click ROAS number from an ad platform. If the scorecard only rewards the closer, brand work will always look optional.
That definition forces three separations. First, brand building versus sales activation are jobs inside one budget, the language Binet and Field popularized and our content vs performance piece already owns for allocation debates. Second, brand KPIs versus sales KPIs are linked but not identical: awareness, consideration, preference, and share of search sit upstream of revenue. Third, measurement maturity is not confidence. Nielsen’s Marketing ROI Blueprint reports that 85% of marketers feel extremely or very confident measuring holistic ROI, while only 32% actually measure traditional and digital spending holistically (Nielsen).
If your team quotes confidence and cannot name the experiment calendar, you are in the 85%, not the 32%.
It matters because short windows, click credit, and siloed brand/performance teams systematically understate equity work and then cut it. CFOs are not wrong to ask for ROI. They are wrong when the only accepted proof is a platform report that was never designed to see brand.
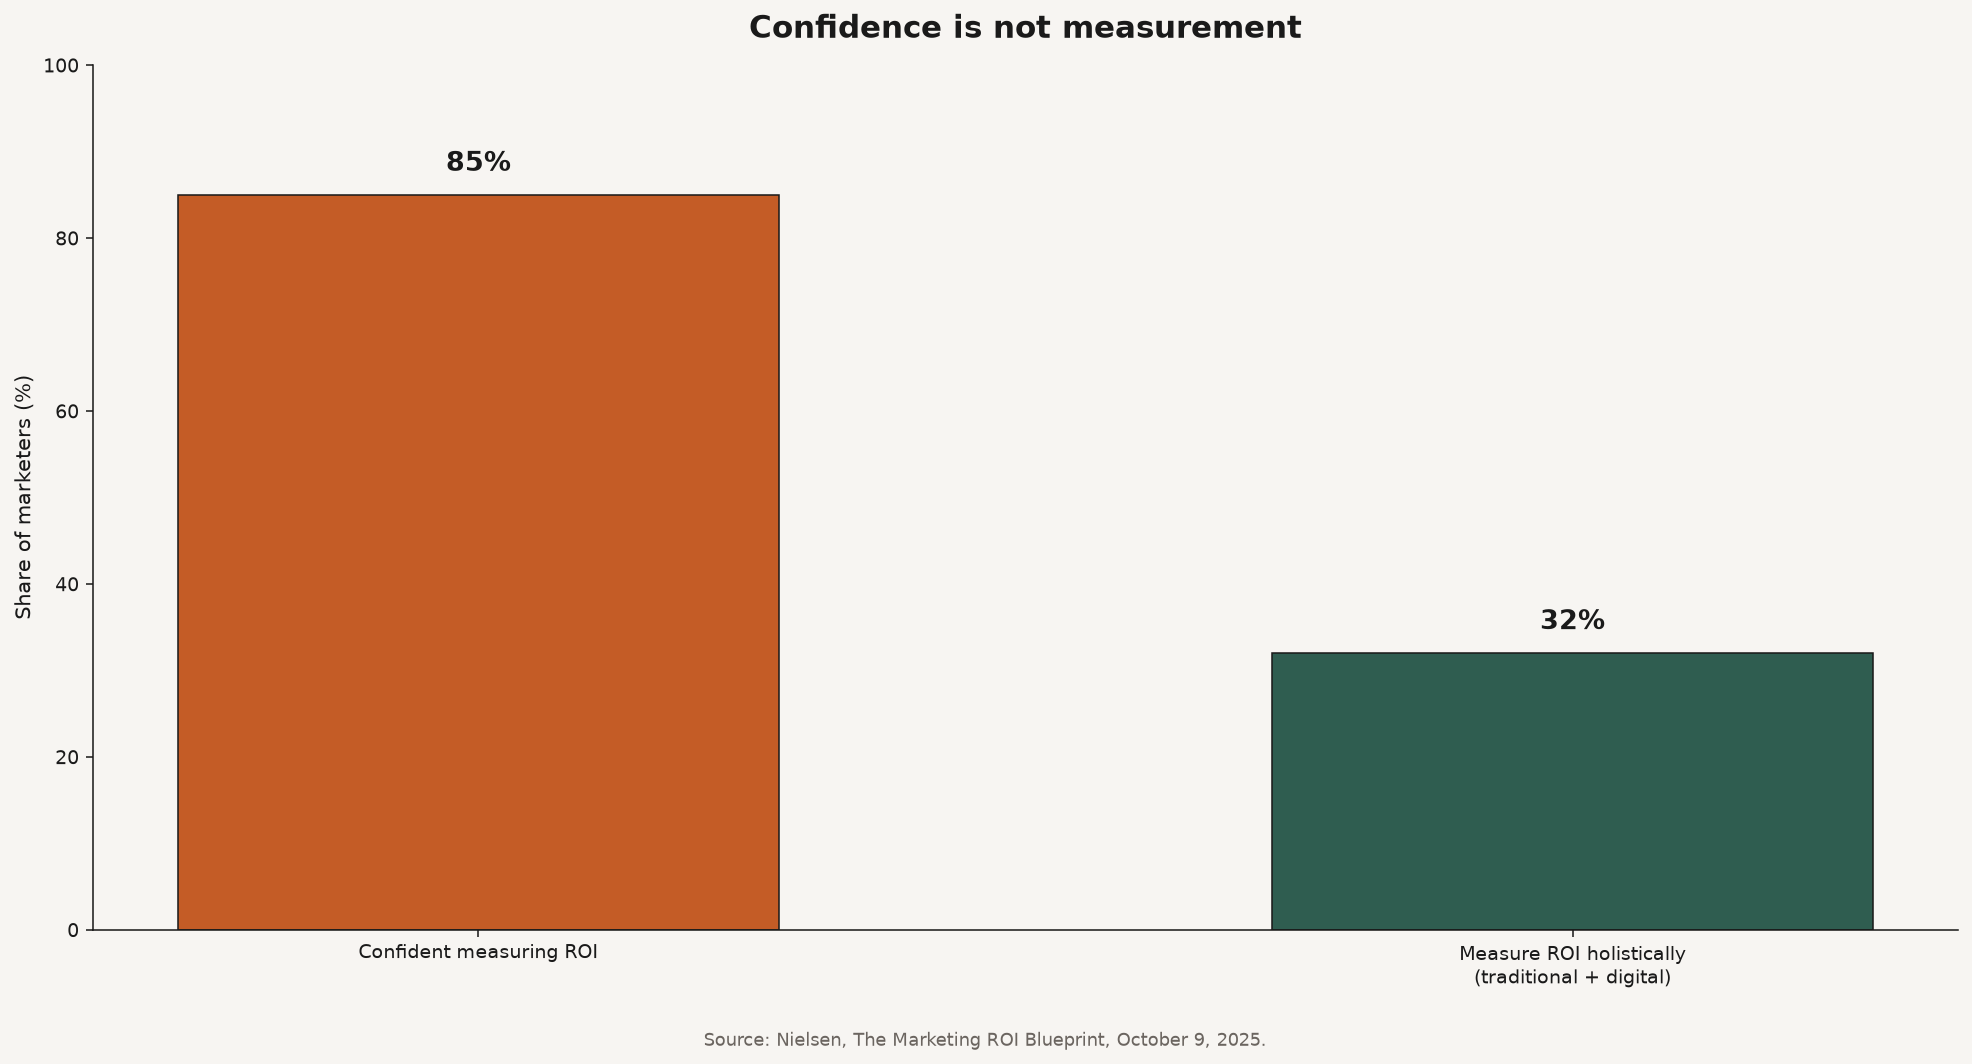
Source: Nielsen, The Marketing ROI Blueprint press release, October 9, 2025. https://www.nielsen.com/news-center/2025/nielsen-unveils-makerting-roi-blueprint/.
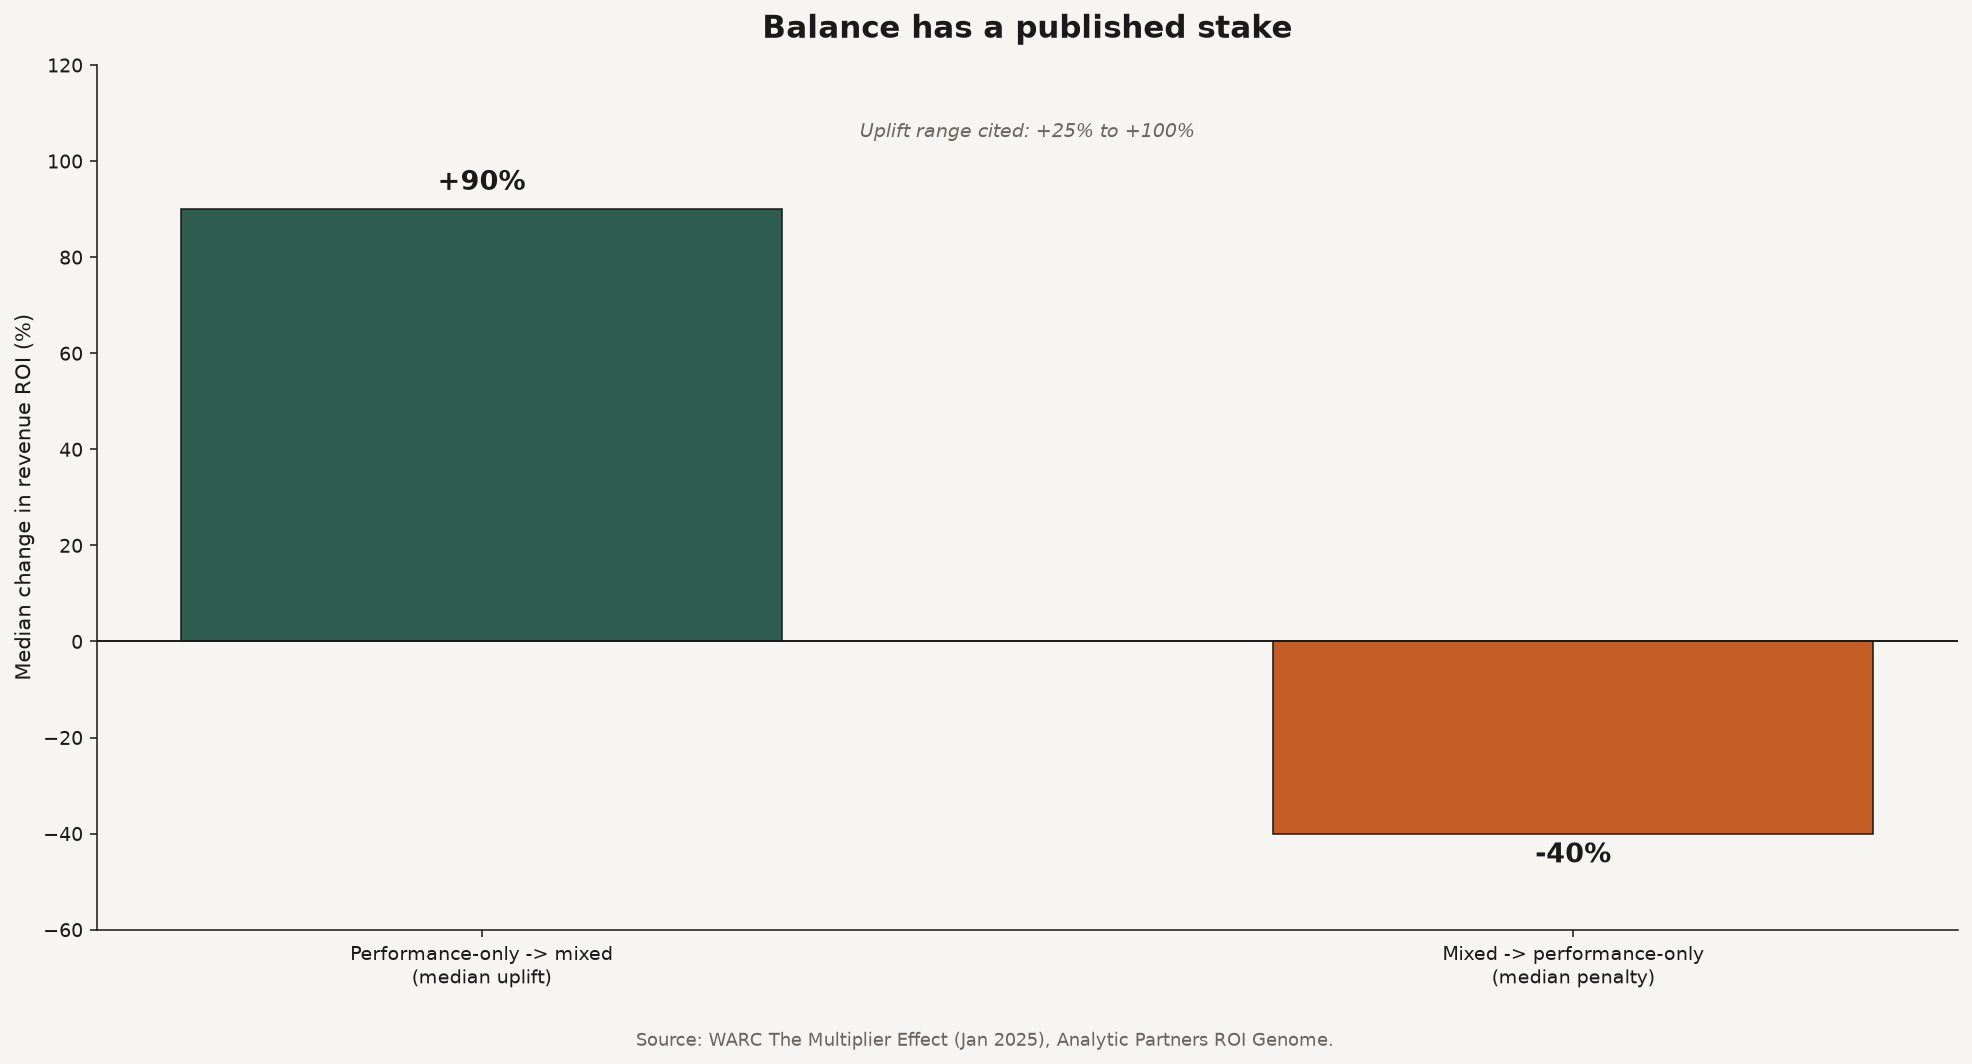
Source: WARC, The Multiplier Effect (January 2025), Analytic Partners ROI Genome figures as reported by Prophet and Media Update. https://prophet.com/2025/01/the-multiplier-effect-a-cmos-guide-to-brand-building-in-the-performance-era/.
Brand marketing ROI measurement works when you assign each tool a job on one commercial question, then refuse to let execution metrics veto the rest. BCG’s four-legged stool covers modeling, incrementality experiments, customer insights, and execution metrics (BCG). Google’s playbooks add Brand Lift, share of search, and nested MMM so equity is not invisible inside a lower-funnel model.
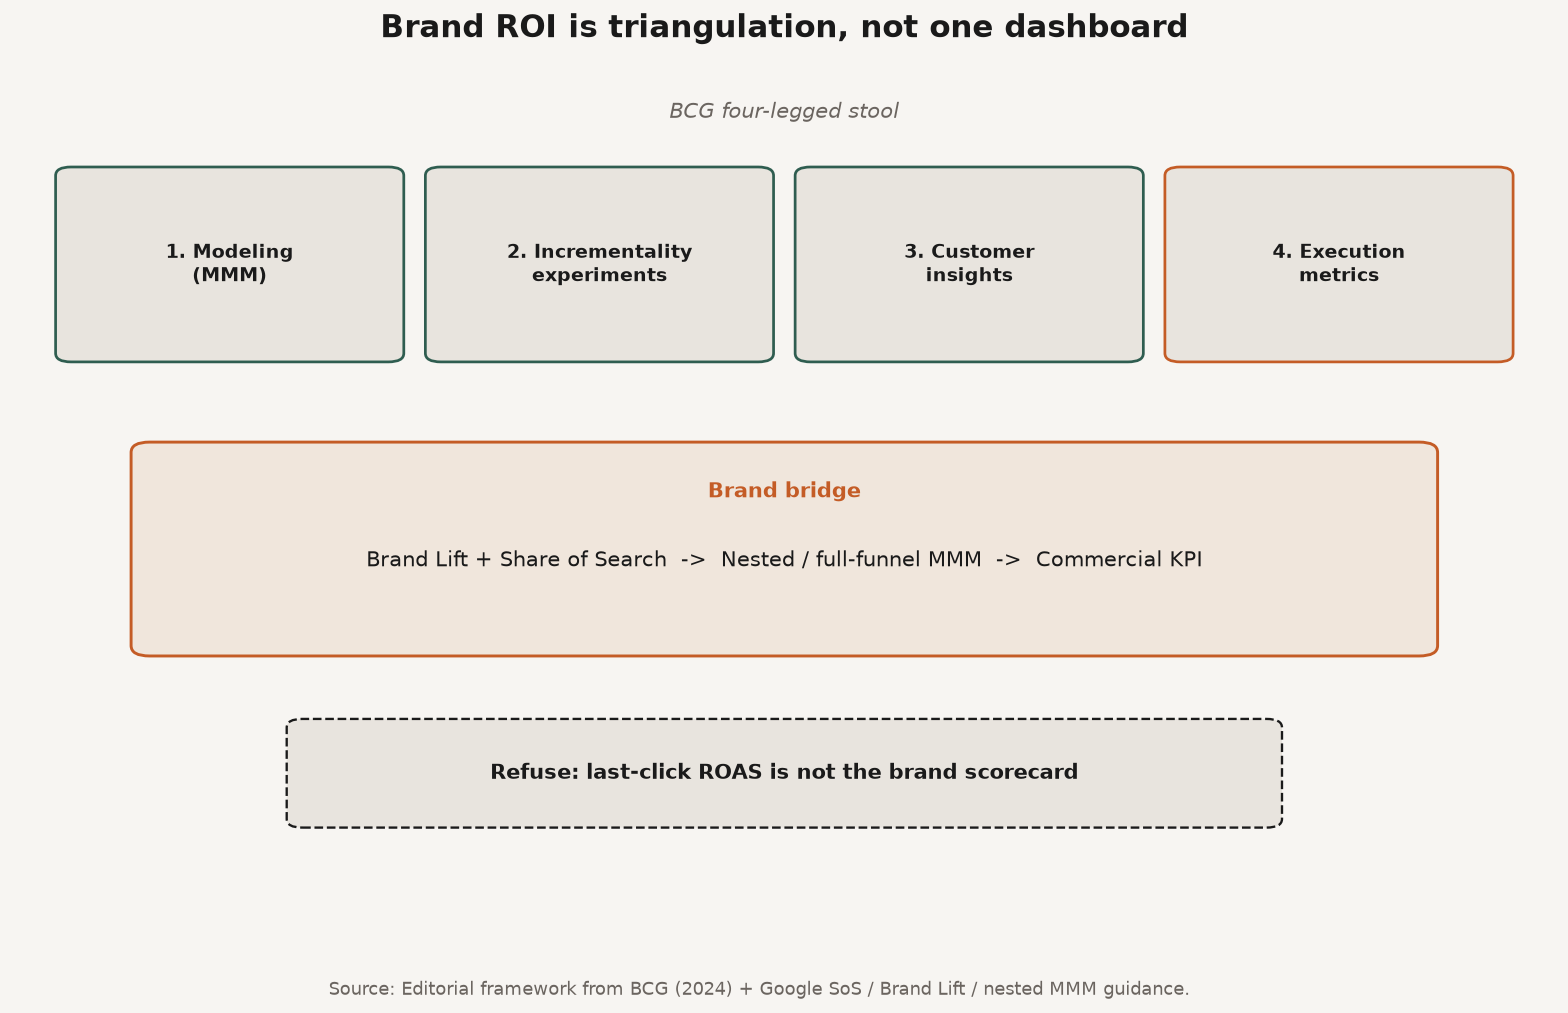
Source: Editorial framework combining BCG’s four-legged stool (Aug 2024) with Google nested MMM / SoS / Brand Lift guidance. https://www.bcg.com/x/the-multiplier/four-legged-approach-to-understanding-marketing-roi.
| Tool | Job it owns | What it cannot do alone |
|---|---|---|
| Execution metrics (clicks, CTR, platform ROAS) | Near-real-time pacing and creative hygiene | Prove incrementality; BCG flags self-report bias and credit theft (BCG) |
| Brand Lift / brand tracking surveys | Attitudinal lift from exposure (awareness, consideration, favorability) | Translate lift into dollars without a sales link or CPLU-style bridge |
| Share of Search (SoS) | Proxy for active brand interest vs competitors; Google cites IPA 0.83 correlation with market share | Isolate media-only effects; competitors, PR, and product news move SoS too |
| Marketing mix modeling (MMM) | Portfolio contribution with controls for price, seasonality, competition | Creative-level truth without experiments; needs data history |
| Nested / full-funnel MMM | Brand media -> brand equity (SoS, branded query volume) -> sales | Extra identification burden; Meridian documents the two-stage logic (Meridian) |
| Geo / conversion lift tests | Causal snapshot for a channel or tactic | Continuous always-on portfolio view; expensive if overused |
Share of Search is usually computed as brand searches divided by brand-plus-competitor searches, times 100 (Google Modern Brand Measurement). Use it as a weekly vital sign, not as courtroom proof that one YouTube flight “caused” the brand.
Start with a correlation you are willing to stress-test. Google’s measurement playbooks walk a practical sequence: estimate how many points of awareness or consideration you need for a sales goal, convert that into people, then price the gap with Brand Lift cost per lifted user metrics where you have them. Nested MMM is the formal version of the same idea: stage one models brand media on equity; stage two models equity plus marketing on the KPI, then propagates the indirect path into ROI (Meridian; TwG Modern Measurement).
Mass Analytics describes a retail nested-model case where a first OLS pass handed uplift to branded search during TV windows; the nested fix recovered TV’s demand creation and a reallocation produced about a 12% total sales uplift (Mass Analytics). Treat that as a method story, not a universal lift rate for your category.
Google also cites that well-implemented MMM work can improve marketing ROI by about 10%, and often 20-30%, when teams actually reallocate (Google Effectiveness Equation). Models that never change the plan are theater.
Reddit threads keep repeating the same founder sentence: brand feels like it works in lift studies and branded search, but nobody can prove it in the performance deck (r/DigitalMarketing). The stack above is the answer those threads keep inventing from scratch.
Allocation and measurement are siblings, not twins. Use content vs performance for the Adobe 57% versus Binet/Field 60:40 debate, and budget by company stage for envelope sizing. Analytic Partners’ Genome guidance that organizations assign at least 50% of budget to brand (no more than 50% to performance) is a measurement-informed floor from their database, not a universal law (Analytic Partners). Your nested model and lift tests decide whether you sit at 50, 60, or something tighter for a launch quarter.
Creator and affiliate distribution still need their own scorecards. Influencer payback is a different measurement object (how brands calculate influencer marketing ROI). Do not launder creator fees into “brand ROI” without a designed test.
Brand marketing ROI questions cluster around tools, clocks, and what to refuse. These five answers are written to lift cleanly into AI overviews and CFO emails. Use them as the short form of the stack above, then open the tables when someone asks for method detail.
Q: What is brand marketing ROI measurement? A: It is estimating incremental commercial return from equity-building spend with triangulated tools (MMM, lift tests, brand KPIs, and execution metrics). It is not the same as platform ROAS on the last click before purchase.
Q: How do you measure brand marketing ROI without last-click? A: Combine a brand KPI (Brand Lift or share of search), a commercial KPI, nested or calibrated MMM for portfolio view, and periodic geo or conversion-lift experiments for causality. Use clicks only for pacing.
Q: What is share of search in brand measurement? A: Share of search is your brand’s search volume divided by brand-plus-competitor search volume, expressed as a percentage. Google’s measurement materials cite IPA research showing about a 0.83 correlation between SoS and market share, which makes SoS a useful proxy, not a perfect causal meter.
Q: How long does brand marketing take to show ROI? A: Google’s Effectiveness Equation work finds returns in months 5-24 often match the first four months, so judging brand only inside a short attribution window systematically understates value. Set the review clock before you run the campaign.
Q: Is there an average brand marketing ROI by industry? A: Not as a single trustworthy public ladder you can budget against. Published sources give method benchmarks and portfolio stakes (for example WARC/Analytic Partners median +90% revenue ROI when moving from performance-only to mixed), not a universal industry ROI table. Build your own.
Brand marketing ROI measurement fails when teams ask a performance dashboard to answer a brand question. Nielsen’s confidence gap, Google’s carryover evidence, and Analytic Partners’ search-credit math all point the same way: triangulate, nest brand equity into the model, and test for lift. Last-click can stay for hygiene. It cannot own the brand scorecard.
If you want distribution partners who carry your brand story into co-branded storefronts instead of only renting clicks, start at feat..
Affiliate marketing for startups is an operating system—locks, cost, recruit, rates, tracking, first 100 sales, then diagnose a flat roster.
Build a commission-based sales network as a single-tier seller graph—economics, surface, named sellers, then density. Rewardful: only 1.28% of affiliates sell.
Build a product distribution network on four rails—DTC, wholesale, commission sellers, co-branded storefronts. Densify before you scale; Lowe’s pays up to 20% on storefronts.