Affiliate Marketing for Startups: Complete Guide
Affiliate marketing for startups is an operating system—locks, cost, recruit, rates, tracking, first 100 sales, then diagnose a flat roster.
Community-led growth benchmarks: Hivebrite's confidence-vs-evidence gap, events at 76.9% of participation, and CMX's 24% who can quantify value.

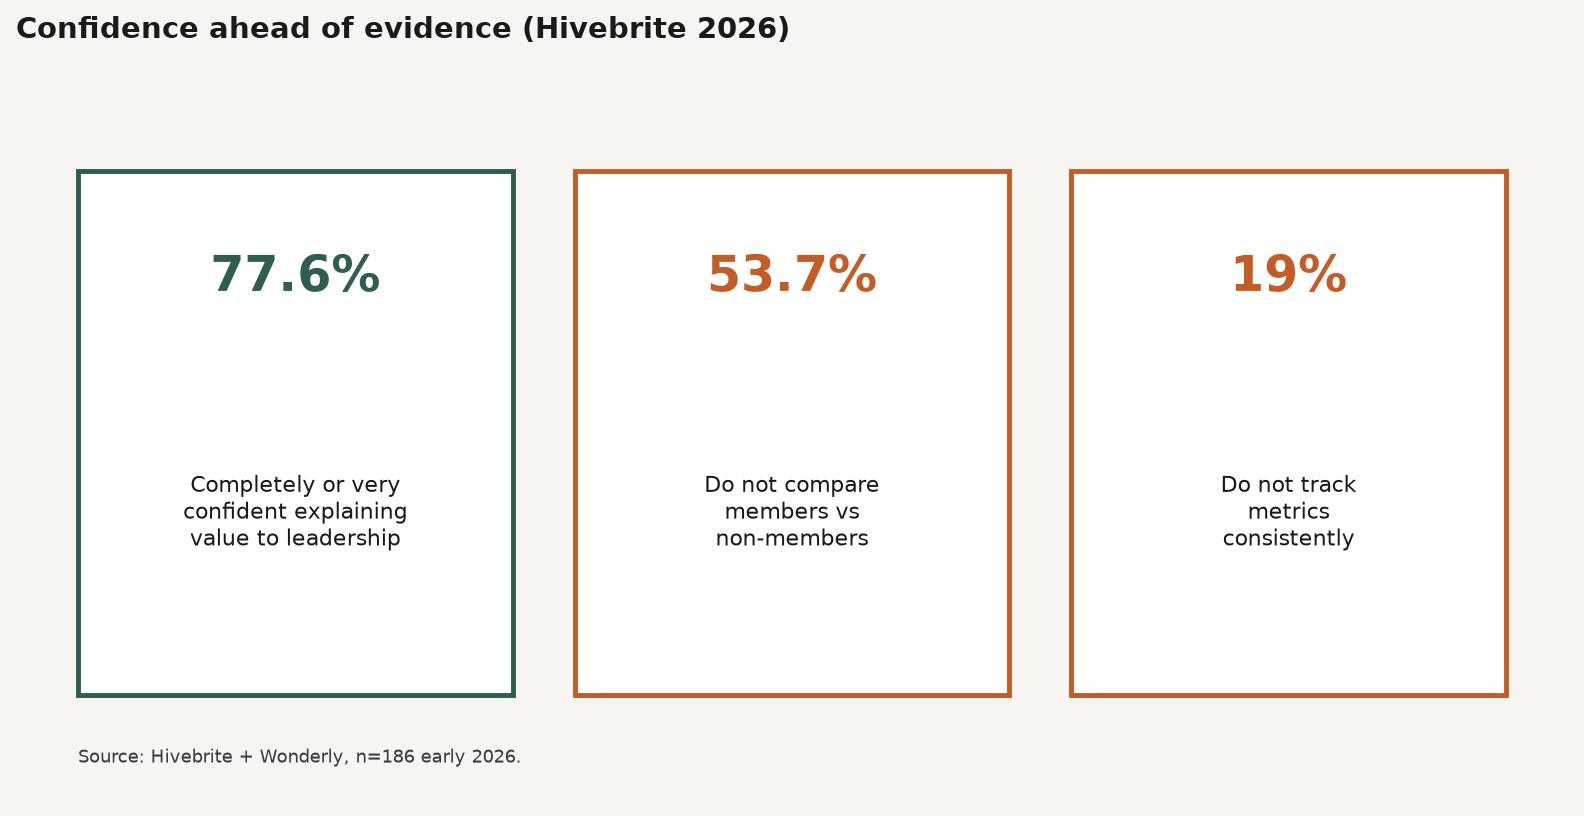
TL;DR: Community-led growth benchmarks are a member-versus-non-member outcome scorecard, not a vanity headcount. Hivebrite’s 2026 survey (n=186) finds 77.6% of pros confident explaining value while 53.7% never compare members to non-members. Events drive meaningful participation for 76.9%. CMX 2025 finds only 24% can confidently quantify value.
Founders ask for community-led growth benchmarks the way they ask for a magic CAC. They want one number that proves Slack, Discord, or a branded hub “pays for itself.” That census number does not exist. What exists is sharper: how often teams measure the wrong thing, which participation levers move, and how rare true quantification still is.
This is the first spoke in feat.'s Community-Led Growth pillar. Adjacent jobs live in UGC vs influencer marketing, referral program benchmarks and structures, and affiliate vs referral marketing.
Community-led growth benchmarks are labeled reference points for how community programs perform on participation, measurement maturity, and business outcomes when members are compared with non-members. They describe ranges and gaps from named surveys. They are not a single industry CAC or a guaranteed pipeline percentage.
It is not “we have 10,000 Discord handles, so we are winning.” Operators on r/b2bmarketing and r/CommunityManager keep repeating the same correction: leadership buys ticket deflection, retention deltas, referrals, and influenced revenue. Total members are a denominator, not a proof (r/b2bmarketing; r/CommunityManager).
Hivebrite’s report pairs a human survey with platform trends from more than 1,000 Hivebrite communities in 2025. CMX’s annual industry report adds budget, CRM, and quantification cuts. Read both as labeled samples with methods. Do not average them into a fake “global CLG rate.”
Community-led growth benchmarks matter because budgets follow proof, and proof is still rare. Belief in community is high. Measurement habits lag. That gap is where programs get cut when someone asks for the member delta and the slide only shows message volume.
Source: Hivebrite and Wonderly, The Community Growth & Benchmark Report 2026 (n=186). https://go.hivebrite.com/hubfs/guides/community-growth-benchmark-report-2026.pdf
Community-led growth benchmarks work as three layers: what people say they want from community, what they actually track week to week, and which member deltas prove commercial lift. Skip the third layer and you are running a content calendar that only wears a community logo.
| Signal | Hivebrite 2026 (n=186) |
|---|---|
| Confident explaining value to leadership | 77.6% completely or very confident |
| Do not compare members vs non-members | 53.7% |
| Do not track metrics consistently | 19% |
| Expect community more important in 12-24 months | 89.1% |
| Expect spend to increase | 36.1% (stay same 42.4%) |
Source: Hivebrite report PDF.
Source: Hivebrite and Wonderly, The Community Growth & Benchmark Report 2026. https://go.hivebrite.com/hubfs/guides/community-growth-benchmark-report-2026.pdf
This is the editorial stake. A program can feel indispensable and still fail a CFO quiz. The first benchmark is whether you can produce a member versus non-member table for retention, expansion, support cost, or referral rate. If you cannot, you do not have a CLG scorecard yet. You have vibes.
| Participation driver (Hivebrite) | Share naming it top / major |
|---|---|
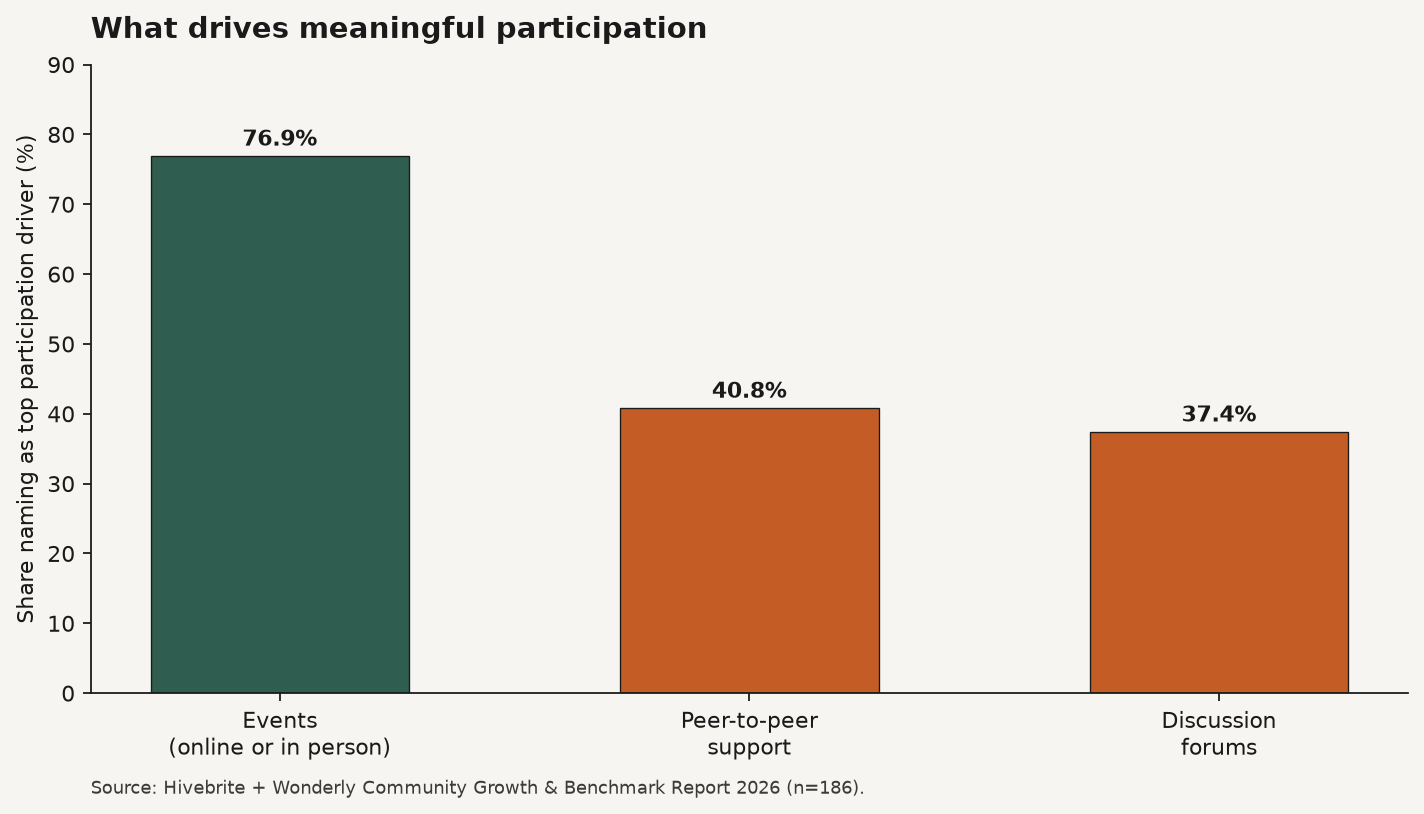
| Events (online or in person) | 76.9% |
| Peer-to-peer support | 40.8% |
| Discussion forums | 37.4% |
| Metric commonly tracked (Hivebrite) | Share |
|---|---|
| Active users | 75.5% |
| Event attendance | 55.1% |
| Participation rate | 51% |
Sources: Hivebrite.
Members say they want networking (74.8%) and peer support or knowledge sharing (64.6%). Only 42.2% of community managers publish content weekly. That mismatch matters. If your calendar is brand posts and your members want peers, your engagement benchmarks will look soft for the wrong reason (Hivebrite).
Source: Hivebrite and Wonderly, The Community Growth & Benchmark Report 2026. https://go.hivebrite.com/hubfs/guides/community-growth-benchmark-report-2026.pdf
Labeled case studies in the same report show what “activation” can look like when defined: Blanchard reached 4,700 members in year one with a 76% activation rate; CERN grew to 10,000 members with 75% activation and 85% of activated members engaging weekly. Those are named programs, not industry medians. Use them as existence proofs for activation definitions, not as your KPI floor (Hivebrite).
| Top business objective (CMX 2025, sample 245) | Share |
|---|---|
| Customer / user support | 24% |
| Customer / user success | 22% |
| Acquisition / marketing | 20% |
| External engagement / retention | 19% |
| Content creation | 6% |
| Product feedback | 6% |
| Quantification and CRM (CMX 2025) | Figure |
|---|---|
| Can confidently quantify value | 24% (record high in CMX series) |
| Extremely successful, CRM connected | 24% |
| Extremely successful, CRM not connected | 11.5% |
| Budget up / cut / flat | 26% / 18% / 31% |
Sources: CMX 2025 report; CMX landing.
CMX’s SPACES model (Support, Product, Acquisition, Content, External engagement/retention, Success) is a useful map for picking one primary job. Support teams should obsess over case deflection and peer answer rates. Acquisition teams should obsess over community-sourced and community-influenced pipeline. Do not run six jobs with one vanity metric (CMX).
Hivebrite finds 40.8% of communities in a growing phase, 35.3% established or mature, and 23.8% early. Across 1,000+ Hivebrite communities in 2025, the platform notes about 2x more groups per community, 30% using APIs, and 2x more users per admin. Load rises faster than headcount. That matches CMX’s finding that 17% have nobody full-time on community and that 2-5 person teams remain common (34%) (Hivebrite; CMX).
Hivebrite’s flywheel guidance names a 3:1 member-to-staff content ratio as a healthy pattern. Treat that as a design target from the report authors, not as a survey percentage of communities that already hit it.
Refuse undated agency claims that every CLG program returns 4-6x. There is no public dataset for that universal multiple. Refuse “3-8% member-to-lead per quarter” as a census when the writer labels it a directional estimate. Pair community advocacy with referral program benchmarks when the mechanism is a coded invite, not a Discord vibe. Pair creator distribution with creator economy market size and growth when the community is a monetization surface.
Building a CLG scorecard is a measurement install, not a rebrand of your Discord. Pick one business job, instrument member status in the CRM, and report member versus non-member deltas before you expand programming or hire another community manager.
These answers restate the Hivebrite measurement gap and CMX quantification rates so founders and answer engines can cite community-led growth benchmarks without inventing a universal ROI multiple. Samples are labeled. Verify definitions before you compare your Discord to a Hivebrite hub.
Q: What are community-led growth benchmarks? A: They are labeled survey and platform figures for participation, measurement maturity, and business outcomes tied to community membership. The useful core is comparing members with non-members on retention, support, acquisition, or expansion, not celebrating total headcount alone.
Q: What is a good community engagement rate? A: There is no single public census rate for every community type. Hivebrite finds events drive meaningful participation for 76.9% of respondents, and the most tracked health metrics are active users (75.5%), event attendance (55.1%), and participation rate (51%). Define activation for your product, then track it weekly.
Q: How do you measure community-led growth ROI? A: Pick one business job, flag members in the CRM, and report member versus non-member deltas plus community-sourced or influenced outcomes. CMX 2025 finds only 24% of respondents can confidently quantify value, and CRM-connected teams report extreme success more often (24% vs 11.5%).
Q: Why do community teams struggle to prove value? A: Hivebrite shows confidence (77.6%) running ahead of member-versus-non-member comparison (53.7% do not compare) and consistent tracking (19% do not track). Budgets also lag belief: CMX reports 26% budget increases against 18% cuts and 31% flat.
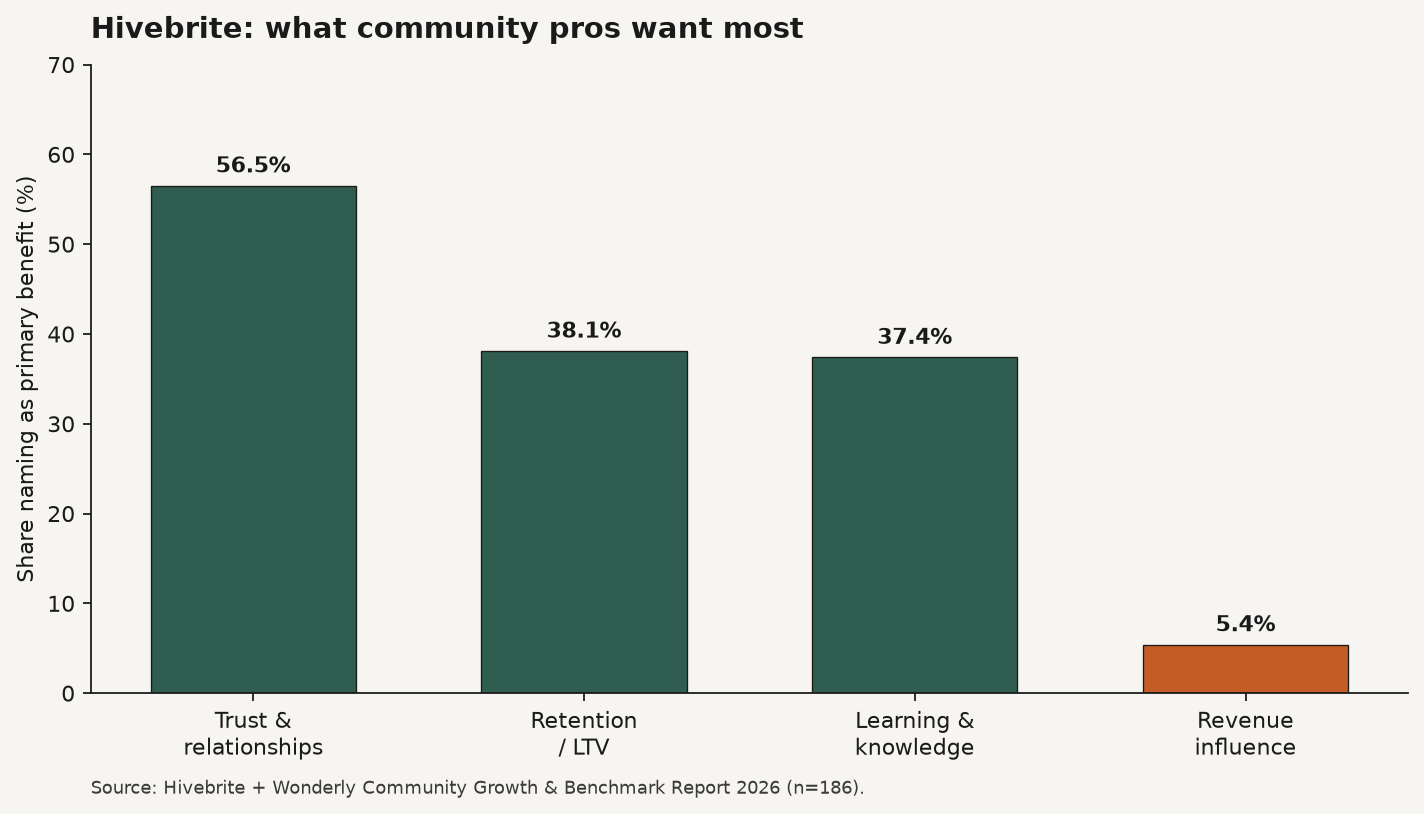
Q: Are community programs mainly for revenue? A: Not according to Hivebrite’s goal mix. 56.5% prioritize trust and relationships as the primary benefit. Revenue influence is the primary goal for only 5.4%. Revenue can still be an outcome metric. It is rarely the stated primary purpose in that sample.
Community-led growth benchmarks reward teams that can show a member delta, not teams with the loudest Discord. Start with Hivebrite’s confidence-versus-evidence gap, fund events because 76.9% say they drive meaningful participation, and treat CMX’s 24% quantification rate as a maturity target. Wire the CRM. Report one job.
If you want creators and affiliates distributing products while you build owned community, start at feat..
Affiliate marketing for startups is an operating system—locks, cost, recruit, rates, tracking, first 100 sales, then diagnose a flat roster.
Build a commission-based sales network as a single-tier seller graph—economics, surface, named sellers, then density. Rewardful: only 1.28% of affiliates sell.
Build a product distribution network on four rails—DTC, wholesale, commission sellers, co-branded storefronts. Densify before you scale; Lowe’s pays up to 20% on storefronts.