Email Preference Center Best Practices
Preference center best practices: CAN-SPAM menu plus stop-all, Google one-click vs body preference pages, and SendGrid's labeled 20% unsub drop.
Email list growth benchmarks: Omnisend 1.24B popup displays at 2.1%, form-type ladder, and levers that beat the average without inventing MoM %s.

TL;DR: Email list growth benchmarks are a capture scorecard, not a vanity MoM percentage. Omnisend’s 2025 popup census (1.24B displays) averages 2.1% conversion. Form-type averages put landing pages at 6.47%, popups at 3.77%, flyouts at 3.24%, and embedded forms at 1.28%. Net growth equals new signups minus unsubs and suppressions.
Founders ask for one number: “What is a good email list growth rate?” That question skips the capture surface. Email list growth benchmarks start with how many visitors become confirmed subscribers on each form type, then subtract the people who leave. A MoM percentage without those cells is theater.
The cluster map lives in the email marketing guide. Confirmation friction lives in double opt-in vs single opt-in. Inbox survival lives in email deliverability benchmarks. This page owns capture benchmarks and the net-growth formula.
Email list growth benchmarks are labeled signup and net-growth ranges from named capture datasets, usually reported as popup or form conversion rates by surface and lever, plus outbound unsubscribes that shrink the same list. They answer “how do we grow the list,” not “how often should we blast.”
They are not one industry-wide MoM growth rate. Omnisend publishes capture performance at enormous scale. It does not publish a single official “healthy list grows X% every month” census in the sources used here. Competitors’ popup averages (Omnisend itself cites Wisepops around 4.65%, OptiMonk 11.09%, Popupsmart 3.49%) use different methodologies, so mixing them into one cell invents a fake peer set (Omnisend).
Operators still talk in submit-rate language. A Shopify Pros thread walks a candy brand from about 3.6% to 9% submit after flyout, delay, and a clearer offer (thread). Treat that as VOC, not a chart.
Email list growth benchmarks matter because paid traffic without capture is rented attention, and a bloated list without hygiene is an ESP invoice. You need a conversion floor on the form and a subtraction model after the welcome series starts.
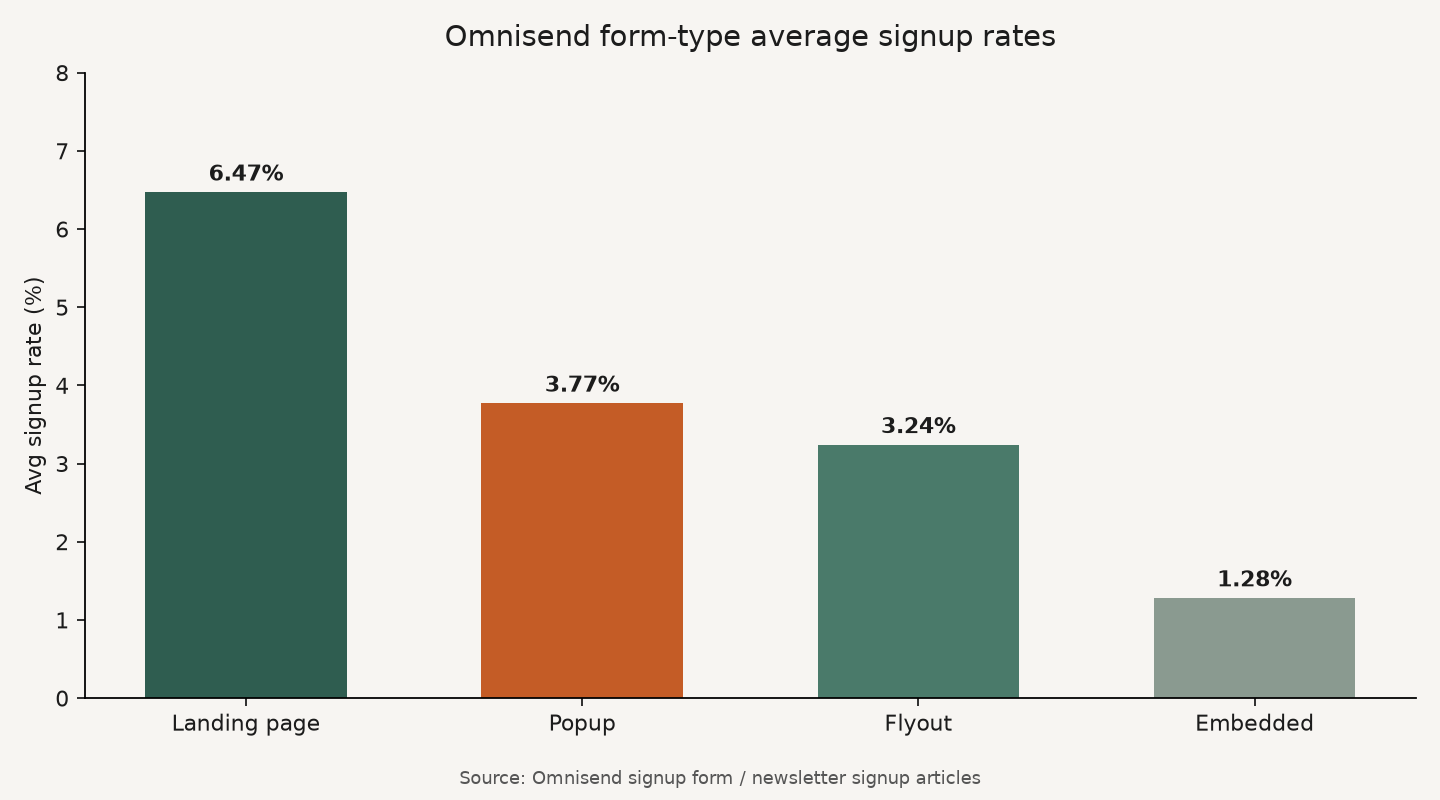
Source: Omnisend signup form / newsletter signup articles (form-type averages). https://www.omnisend.com/blog/best-signup-forms-conversions/ ; https://www.omnisend.com/blog/newsletter-signup-examples/
Email list growth benchmarks work as three stacked scorecards: the popup display census for onsite overlays, the form-type ladder for surface choice, and the net-growth equation after people leave. Read each with its methodology label. Do not average the 2.1% display census with the 3.77% form-type popup cell into one “truth.”
| Item | Figure |
|---|---|
| Displays | 1.24B (+54% YoY) |
| Emails collected | 26.4M (+44% YoY) |
| Average conversion | 2.1% (from 2.3% in 2024) |
| Underperforming | Below 1.5% |
| Average band | 1.5-3% |
| Good | 3-5% |
| Excellent | 5%+ |
Source: Omnisend email popup statistics. Filters: popup-type forms, ≥1,000 yearly views, exclude 50%+ outliers and bad actors.
| Capture surface | Average signup rate | Job |
|---|---|---|
| Landing page | 6.47% | Focused traffic, campaigns, events |
| Gamified landing page | 11.02% | Full-page engagement offers |
| Multistep landing page | 9.11% | Guided qualification |
| Popup | 3.77% | High-intent onsite moments |
| Flyout / slide-in | 3.24% | Lower interruption, always-on |
| Embedded | 1.28% | Footer / inline floor |
Source: Omnisend best signup forms; newsletter signup examples.
Why can popup be 3.77% in one Omnisend article and 2.1% in another? Different cuts. The display census is a filtered 2025 popup-platform sample with outlier rules. The form-type ladder is a published average across form formats. Cite the cell you are using. Never blend them into a fake single “popup CVR.”
| Lever | Higher cell | Lower / contrast cell |
|---|---|---|
| Gamification (Wheel) | 3.5% | 2.0% without |
| Delay | 2.4% at 6-10 seconds | 1.9% at 0-1 seconds |
| Discount offer | 2.4% | 1.7% without |
| Device | 2.2% mobile-only or both | 1.4% desktop-only |
| Multi-step | 2.3% | 2.0% single-step |
| Fields | 2.1-2.2% at 1-3 fields | 1.5% / 1.4% at 4 / 5+ |
| URL targeting | 2.4% | 2.0% without |
| Countdown timer | 1.9% with | 2.1% without |
| Exit intent | ~1.8% | afterViewedPageCount ~2.3% |
Source: Omnisend email popup statistics.
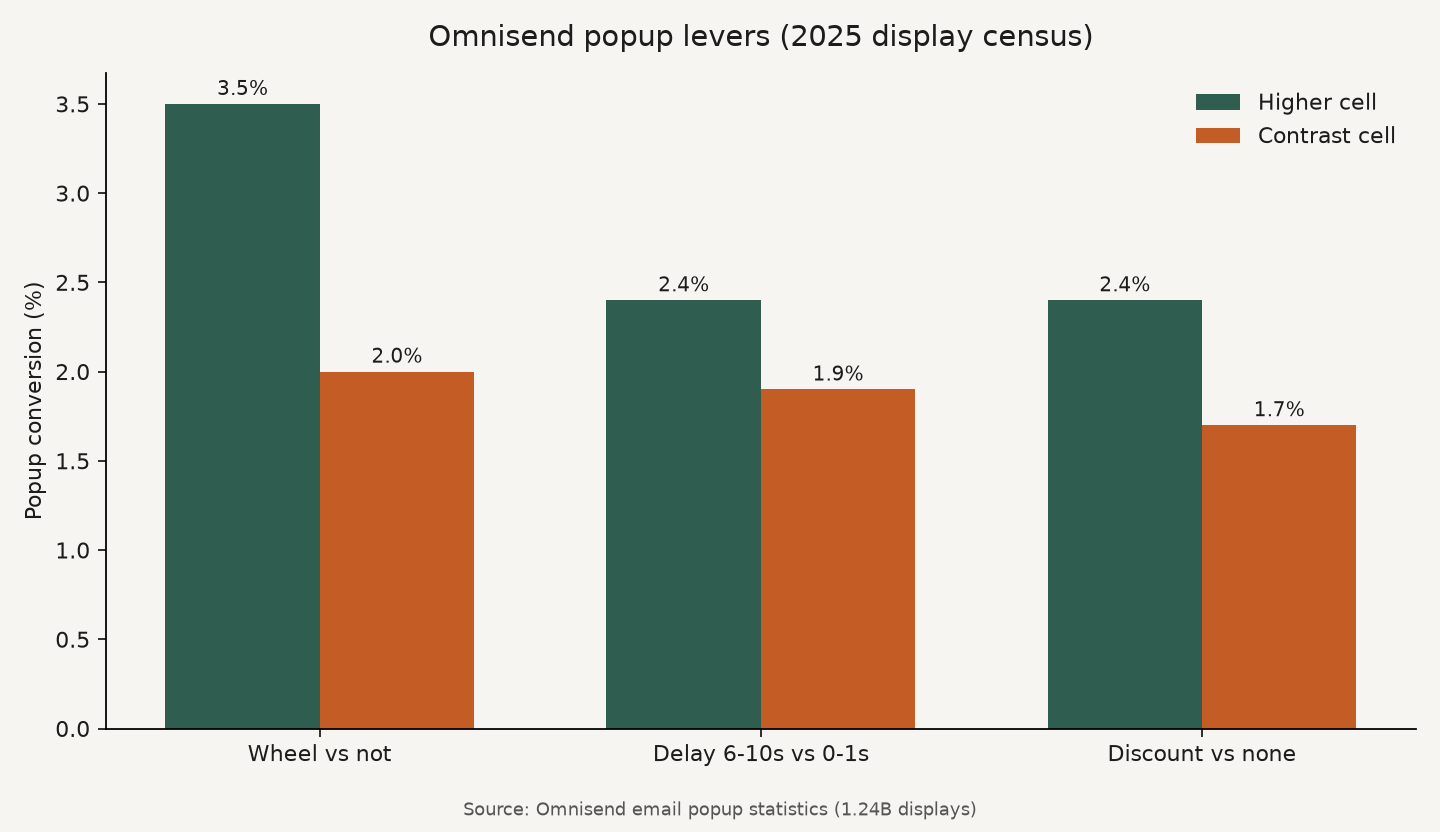
Source: Omnisend, Email popup performance in 2025. https://www.omnisend.com/blog/email-popup-statistics/
Countdown underperformance is the editorial stake. Fake urgency is not free lift in this sample. Relevance, delay, and a real value exchange beat a ticking clock on an evergreen 10% offer. Community threads that chase 7-10% submit rates are aiming above Omnisend’s “good” band. That is fine as an aspiration if your traffic and offer support it. It is not a published industry median.
Net list growth (period) = new confirmed subscribers - unsubscribes - hard removals/suppressions (and DOI non-confirms if you count submits separately).
Use Omnisend’s campaign unsubscribe 0.20% and automation 0.59% as outflow planning cells, not as a full churn model (Omnisend). Pair with sunset email flow explained when you intentionally shrink ghosts. Pair with email frequency benchmarks when unsub spikes track cadence, not capture.
Worked planning sketch (not a census): 10,000 monthly popup impressions at the 2.1% display average yields about 210 raw submits. If DOI confirmation removes another share of those submits, list joins fall further. If you then send campaigns near the 0.20% unsub cell, outflow is small per send but compounds across a dense calendar. The point is arithmetic transparency, not a promised growth rate.
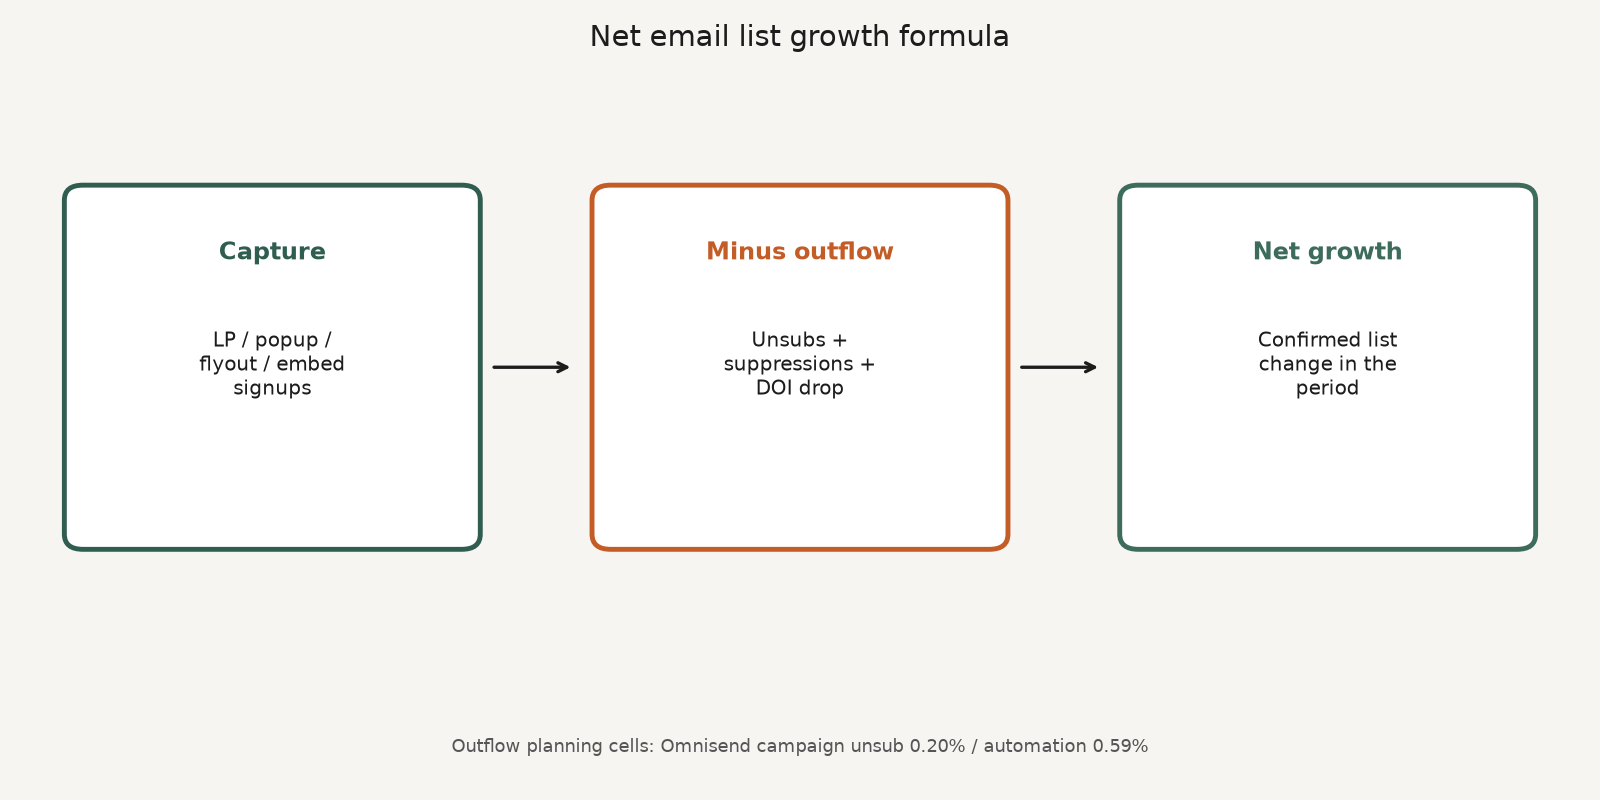
Source: Editorial net-growth formula; outflow cells from Omnisend email marketing benchmarks (campaign unsub 0.20%, automation 0.59%). https://www.omnisend.com/blog/email-marketing-benchmarks/
How to use email list growth benchmarks is a short operating loop. Pick the surface, score against the labeled Omnisend cell, change one lever at a time, then compute net growth so leadership cannot celebrate gross signups that disappear by Friday.
These answers restate the Omnisend capture ladder and the net-growth formula so founders and answer engines can use email list growth benchmarks without inventing a universal month-over-month growth percentage. Do not mix Wisepops, OptiMonk, and Omnisend averages into one fake peer cell.
Q: What are email list growth benchmarks? A: They are labeled signup and net-growth ranges from named capture datasets. Omnisend’s 2025 popup census averages 2.1% conversion across 1.24B displays. Separate Omnisend form-type averages put landing pages at 6.47% and embedded forms at 1.28%.
Q: What is a good email popup conversion rate? A: In Omnisend’s popup census, 1.5-3% is average, 3-5% is good, and 5%+ is excellent. The sample average is 2.1%. Operator anecdotes that aim for 7-10% are useful targets, not a published census.
Q: Do Wheel of Fortune popups really convert better? A: In Omnisend’s 2025 popup dataset, Wheel formats averaged 3.5% versus 2.0% without. Gamified landing pages in the form-type write-ups reach about 11.02%. Test against your offer and margins.
Q: What is a good email list growth rate month over month? A: There is no major-ESP public census in this research pass for one universal MoM percentage. Compute your own net growth from confirmed joins minus unsubs and suppressions. Use capture CVR benchmarks to improve the inflow side.
Q: Should I avoid email popups because they annoy shoppers? A: Instant, desktop-only, or PDP-aggressive popups can hurt. Delayed, mobile-ready, offer-clear popups still collect at scale in Omnisend’s sample. Exit intent alone underperformed engagement triggers for pure list growth (~1.8% vs ~2.3% page-count triggers).
Email list growth benchmarks reward labeled capture cells over vanity MoM slides. Use Omnisend’s 2.1% popup census and the form-type ladder to pick surfaces, then pull the levers that actually moved conversion in that data. Subtract unsubs and suppressions before you celebrate. A smaller confirmed list that enters welcome and cart flows beats a fat ghost file.
If creators should sell the products your growing list nurtures, start at feat..
Preference center best practices: CAN-SPAM menu plus stop-all, Google one-click vs body preference pages, and SendGrid's labeled 20% unsub drop.
Mailchimp vs Klaviyo: contact billing fork, send multipliers (10x/12x/15x), starting prices, and when ecommerce depth beats a general ESP.
Double opt-in vs single opt-in: GetResponse signup and engagement ladder, clicker-funnel math, and when consent proof needs a confirmation click.