Organic vs Paid Growth Channel Comparison
Organic vs paid growth channel comparison: First Page Sage B2B organic CAC $942 vs paid $1,907, why PPC can beat basic SEO, and the B2C flip.
Marketing funnel benchmarks by stage and industry: First Page Sage Lead-to-MQL rates, channel gaps, and why B2B and ecommerce funnels differ.

TL;DR: Marketing funnel benchmarks by stage and industry only work when you name the grammar first. B2B lead funnels (visitor, lead, MQL, SQL, opportunity, close) are not ecommerce purchase funnels. First Page Sage puts average Lead-to-MQL near 31%, with Construction at 17% and Solar or Higher Education near 45%, while SEO leads convert to MQL at 41% versus PPC at 29%.
Most “funnel benchmark” posts give you one percentage and call it strategy. That number is usually an average across mismatched definitions. Marketing funnel benchmarks by stage and industry are only useful when each stage name means the same thing in your CRM that it means in the study.
I care about this as a founder who has watched teams celebrate MQL volume while sales rejects the same leads. The fix is not a prettier dashboard. It is a grammar: which funnel you are in, which industry band applies, and which channel produced the lead.
Key takeaways:
Marketing funnel benchmarks are published conversion rates between named stages of a customer journey, ideally segmented by industry and channel, used as reference ranges rather than targets carved in stone.
A stage conversion rate is completions of the next stage divided by entries into the current stage. “Lead-to-MQL” is not “website conversion.” “MQL-to-SQL” is not “close rate.” If your team mixes those labels, every benchmark becomes theater.
Two grammars show up in real businesses:
| Grammar | Typical stages | Best for | Wrong use |
|---|---|---|---|
| B2B lead funnel | Visitor → Lead → MQL → SQL → Opportunity → Closed | Sales-assisted SaaS, services, high-consideration B2B | Quoting these % against Shopify checkout CVR |
| Ecommerce / purchase funnel | Visit → Product view → Add to cart → Checkout → Purchase (or LP → purchase) | DTC, digital product checkouts, storefront traffic | Calling a cart abandoner an “SQL” |
First Page Sage’s sales-funnel report defines Lead, MQL, SQL, Opportunity, and Closed Won for the B2B grammar, with data gathered 2017 through 2025 and a client mix of about 65% B2B, 20% B2C, and 15% hybrid (Aug 2026). Their B2B SaaS funnel report adds Visitor as stage zero and notes a sample of 50+ SaaS clients over a decade, mostly in the $10M-$100M revenue band (Jun 2025).
For purchase-grammar TOFU, Unbounce’s Q4 2024 landing-page sample (about 41,000 pages) puts median conversion near 6.6% (Unbounce). That number belongs next to storefront vs landing page, not next to MQL-to-SQL.
Stage-and-industry benchmarks matter because a blended average hides the leak you can actually fix.
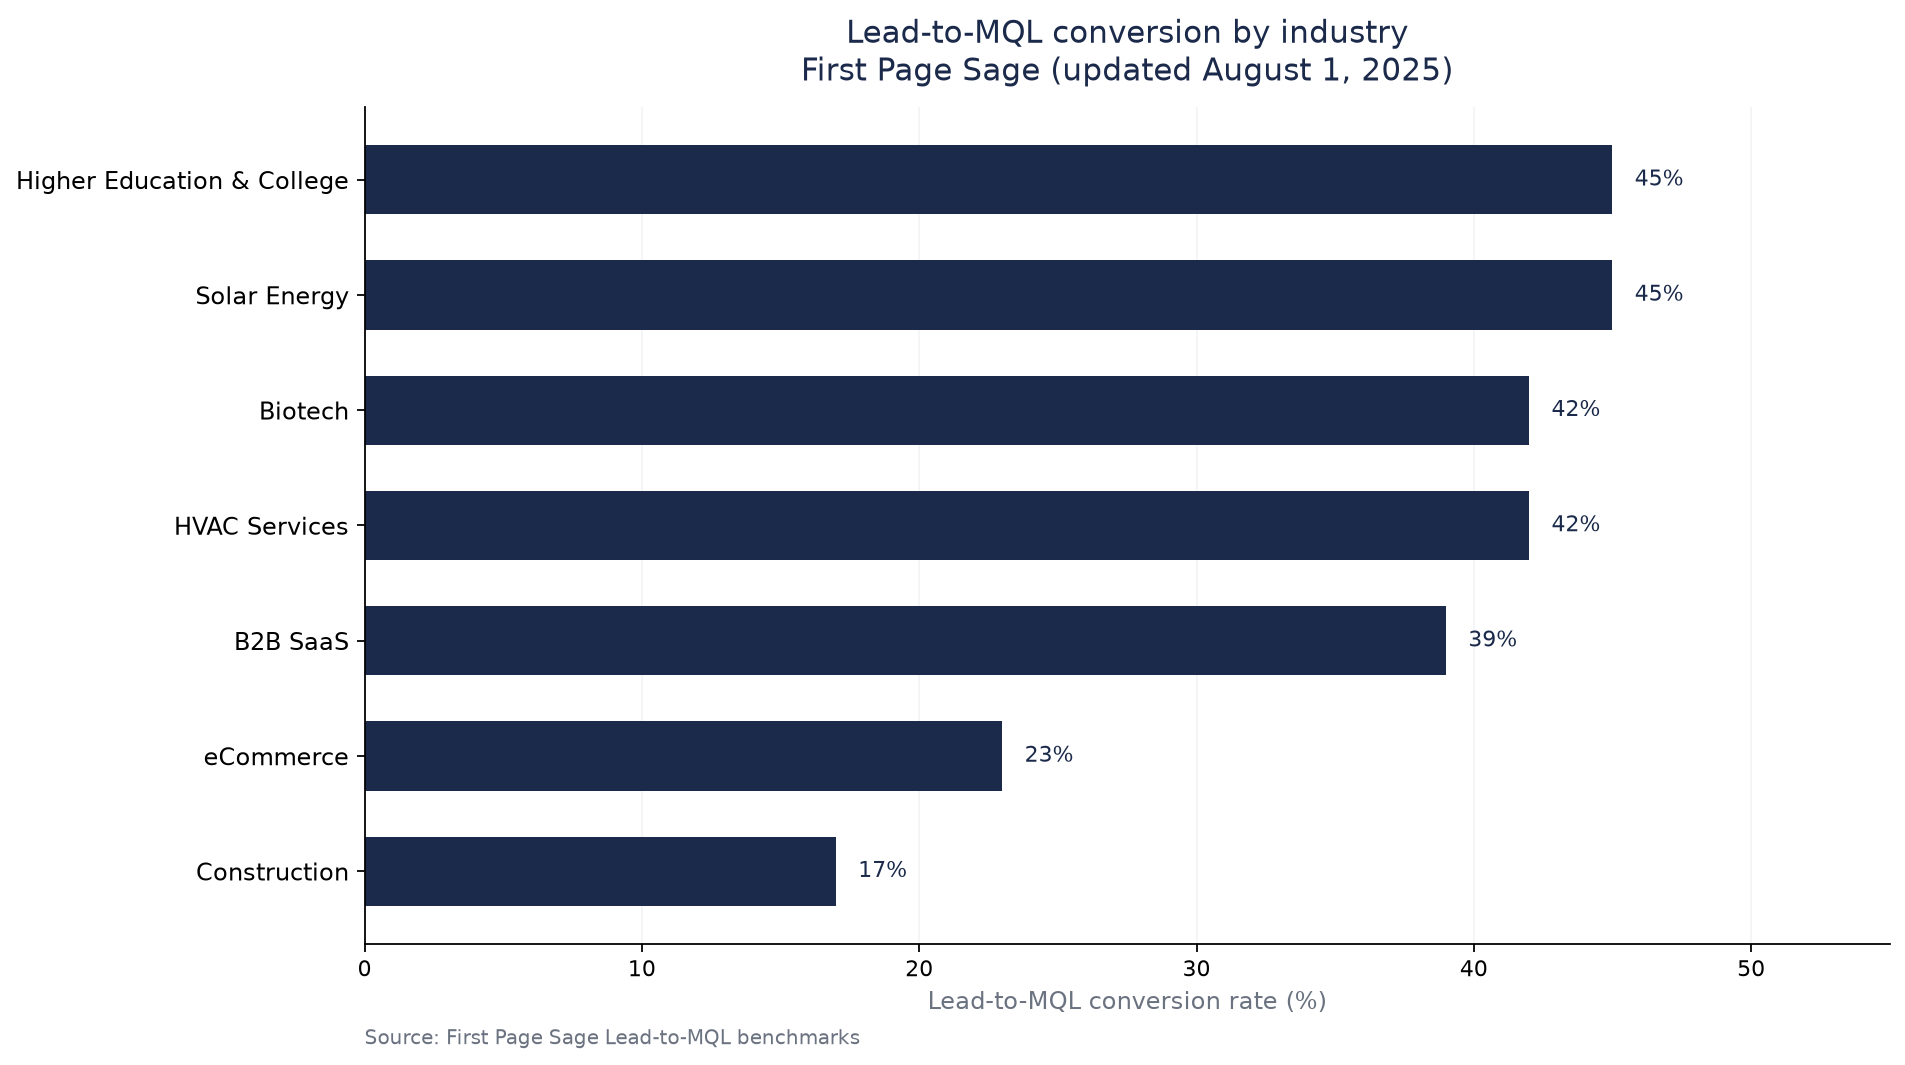
Source: First Page Sage, Lead-to-MQL Conversion Rate Benchmarks by Industry & Channel (updated August 1, 2025). https://firstpagesage.com/reports/lead-to-mql-conversion-rate-benchmarks-by-industry-channel-fc/
Marketing funnel benchmarks work by locking stage definitions, picking the industry and channel slice that matches your motion, then reading each transition as a diagnostic rather than a vanity KPI.
If you sell with demos and contracts, use the B2B lead grammar. If you sell with carts and one-click checkout, use the purchase grammar. Affiliate and creator commerce often straddle both: a co-branded storefront is purchase grammar; a B2B partner program with SQLs is lead grammar. Do not average them. For how tracked partner sales fit the commercial contract, see how affiliate marketing works.
First Page Sage defines leads as contacts who submitted information and MQLs as leads in the target market / buyer persona. Their cross-cut average Lead-to-MQL rate is 31% (Aug 2025). Page type matters too: product landing pages and white papers sit near 38% Lead-to-MQL in their table, while hub pages sit near 20%. That is why shipping every visitor into a generic “resources” hub can look busy and still starve sales.
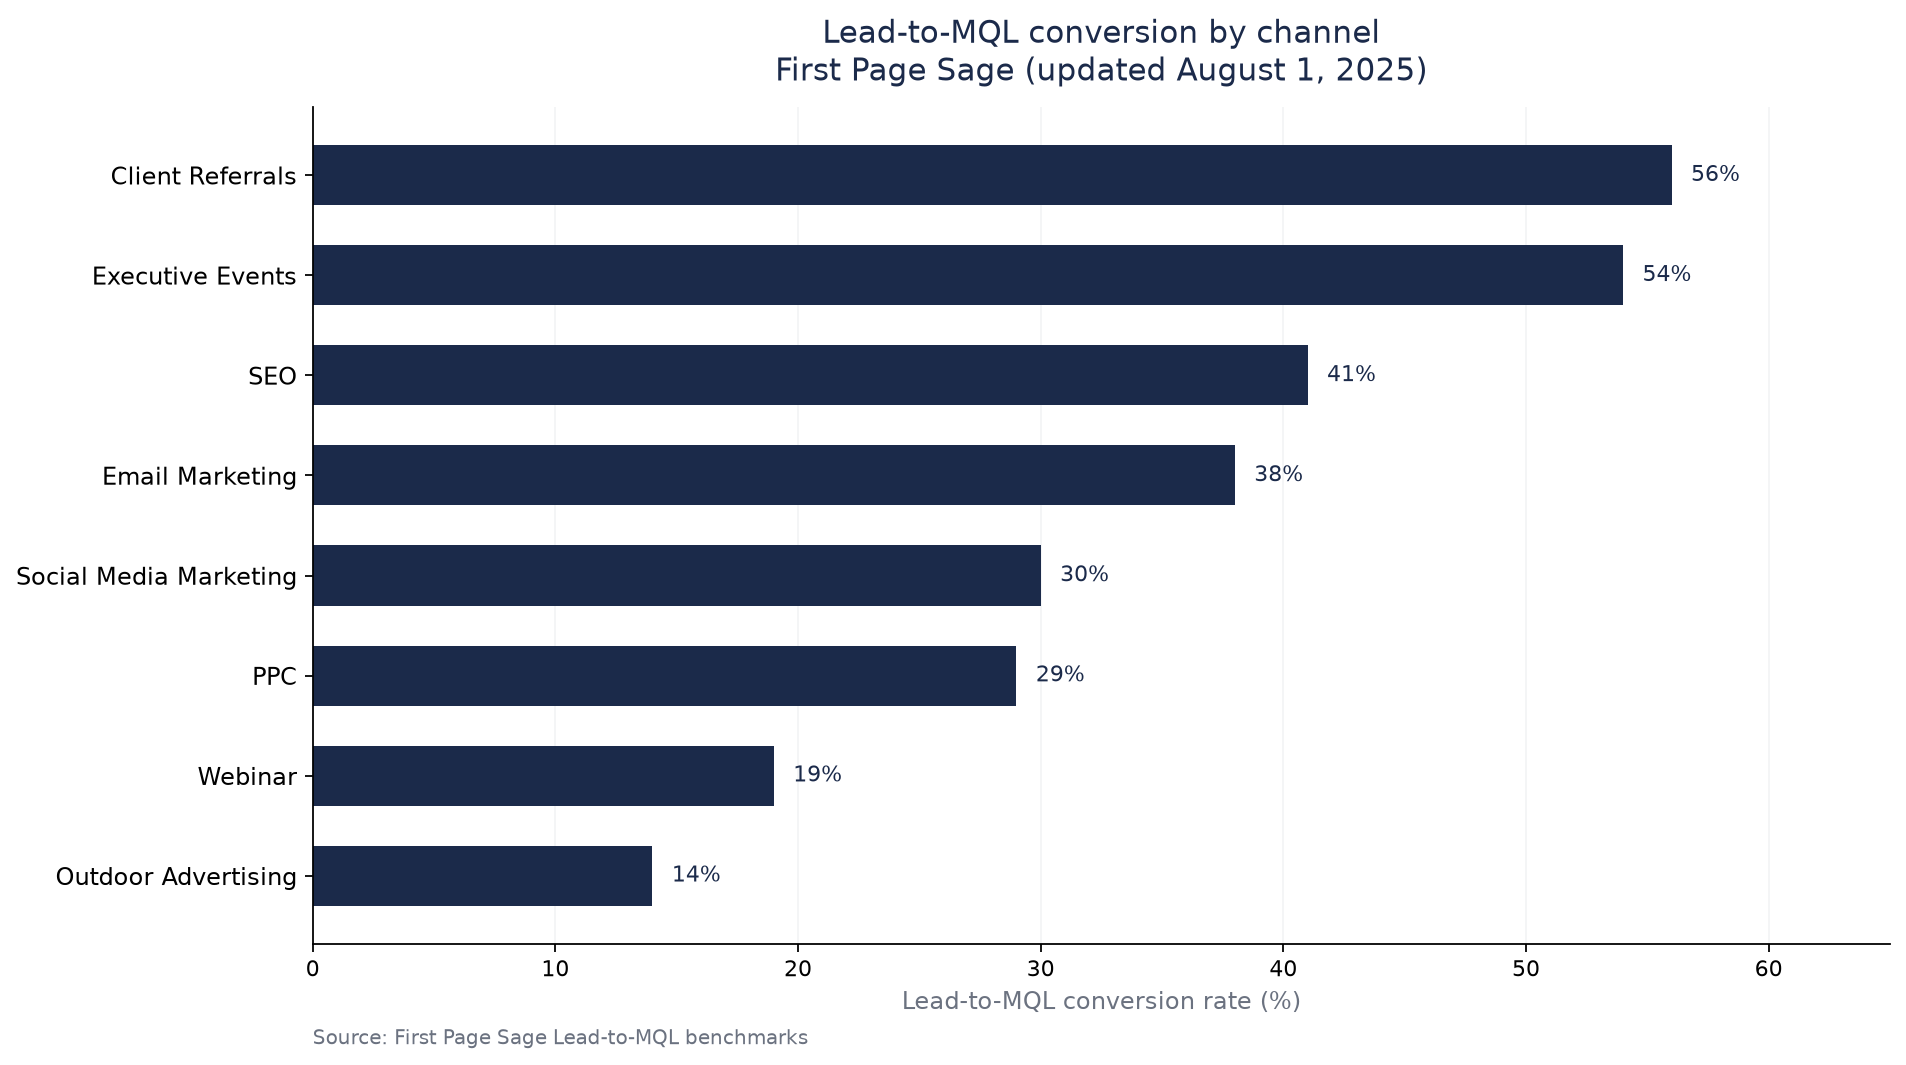
Source: First Page Sage, Lead-to-MQL Conversion Rate Benchmarks by Industry & Channel (updated August 1, 2025). https://firstpagesage.com/reports/lead-to-mql-conversion-rate-benchmarks-by-industry-channel-fc/
In First Page Sage’s B2B SaaS channel benchmarks, visitor-to-lead is 2.1% for SEO and 0.7% for PPC, while MQL-to-SQL is 51% for SEO and 26% for PPC (Jun 2025). The report states an assumption of competent execution (thought-leadership SEO, tested PPC landing pages, targeted email). Under those same stage definitions, multiplying the SEO path rates yields roughly 0.08% visitor-to-close, versus roughly 0.009% for the PPC path, about a 9× gap in this illustration. That is not a claim that SEO always beats paid. It is a claim that channel mix changes which stage looks “broken.”
| B2B SaaS stage (FPS) | SEO | PPC | |
|---|---|---|---|
| Visitor → Lead | 2.1% | 0.7% | 1.3% |
| Lead → MQL | 41% | 36% | 43% |
| MQL → SQL | 51% | 26% | 46% |
| SQL → Opportunity | 49% | 38% | 48% |
| Opportunity → Close | 36% | 35% | 32% |
Source: First Page Sage, B2B SaaS Funnel Conversion Benchmarks (updated June 11, 2025). https://firstpagesage.com/seo-blog/b2b-saas-funnel-conversion-benchmarks-fc/
Here is a compact cut from First Page Sage’s 2026 sales-funnel industry table. Use it to sanity-check your CRM, not to set a board OKR without context.
| Industry | Lead → MQL | MQL → SQL | SQL → Opportunity | Opportunity → Closed |
|---|---|---|---|---|
| B2B SaaS | 39% | 38% | 42% | 37% |
| eCommerce | 23% | 58% | 66% | 60% |
| Construction | 17% | 37% | 50% | 54% |
| Higher Education | 45% | 46% | 61% | 66% |
Source: First Page Sage, Sales Funnel Conversion Rate Benchmarks: 2026 Report (updated August 10, 2026). https://firstpagesage.com/seo-blog/sales-funnel-conversion-rate-benchmarks-report/
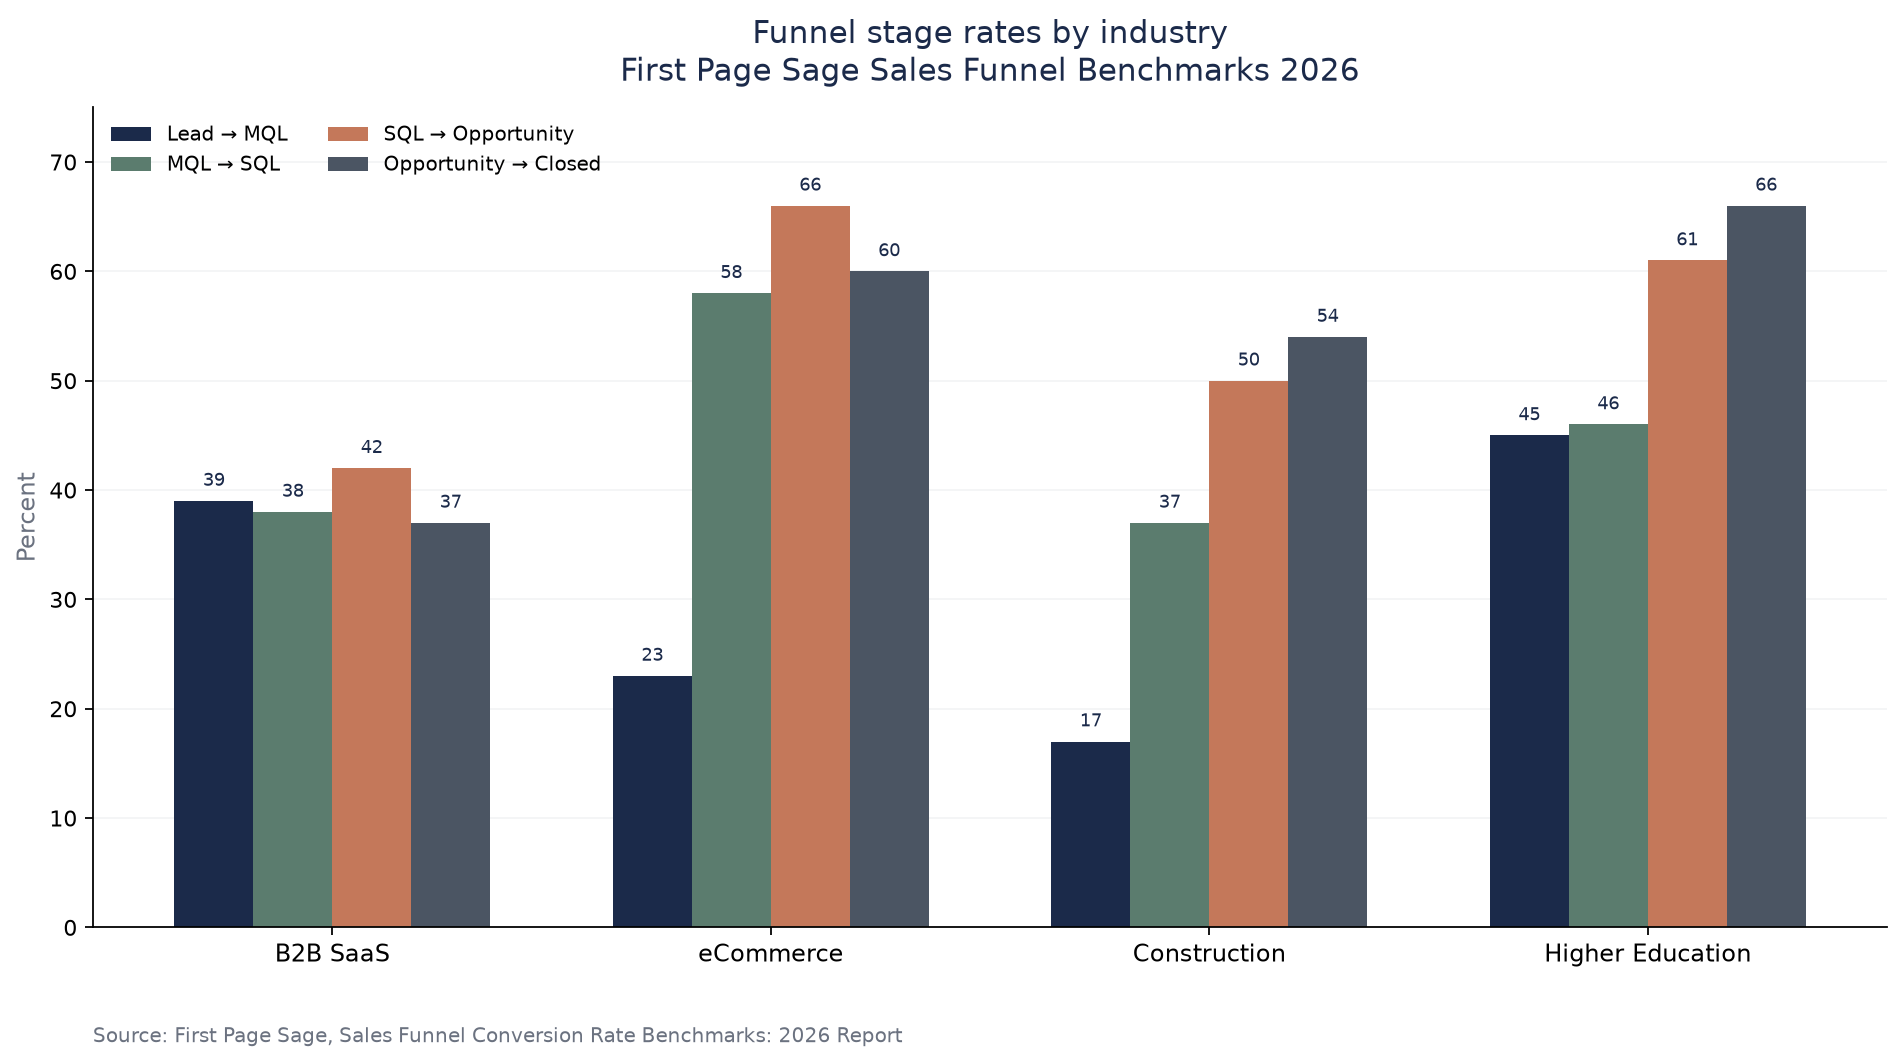
Source: First Page Sage, Sales Funnel Conversion Rate Benchmarks: 2026 Report. https://firstpagesage.com/seo-blog/sales-funnel-conversion-rate-benchmarks-report/
Q: What are marketing funnel benchmarks by stage and industry? A: They are reference conversion rates between named funnel stages, broken out by industry (and often by channel). First Page Sage publishes Lead-to-MQL, MQL-to-SQL, and later-stage rates from multi-year client datasets. Use them as diagnostic ranges after you match definitions, not as universal targets.
Q: What is a good lead to MQL conversion rate? A: First Page Sage’s cross-industry average is about 31%, with Construction near 17% and Solar or Higher Education near 45%. “Good” is relative to your industry band and channel mix. A rate far above your band can also mean your MQL definition is too loose.
Q: What is a good MQL to SQL conversion rate? A: It depends on definitions and motion. First Page Sage’s 2026 industry table puts B2B SaaS near 38% and eCommerce near 58% under their sales-funnel definitions. Operator communities often cite much lower bands when SQL means sales-accepted pipeline. Align the definition before you panic.
Q: How do B2B SaaS funnel benchmarks differ by channel? A: In First Page Sage’s B2B SaaS channel table, SEO shows 2.1% visitor-to-lead and 51% MQL-to-SQL, while PPC shows 0.7% and 26% on those same stages. Email sits between them on several steps. Channel quality can look like a funnel problem if you only watch blended rates.
Q: Can I use the same funnel benchmarks for ecommerce and B2B lead gen? A: No. Ecommerce purchase funnels and B2B lead funnels are different grammars. For purchase TOFU, Unbounce’s median landing-page conversion near 6.6% is a better reference family than MQL-to-SQL. Keep separate scorecards and do not average them into one “funnel CVR.”
Marketing funnel benchmarks by stage and industry are a definition problem before they are a performance problem. Name the grammar, pick the industry row, read the channel column, and only then decide which leak deserves a sprint. When your offer sells through partners as well as your own site, keep partner tracking on a clean contract and browse products worth promoting on https://www.feat.press/marketplace.
Organic vs paid growth channel comparison: First Page Sage B2B organic CAC $942 vs paid $1,907, why PPC can beat basic SEO, and the B2C flip.
Marketing budget allocation by company stage: SaaS Capital's 8% median, equity-backed +100% vs bootstrap, and why unit economics beat round-label tables.
Affiliate marketing for startups is an operating system—locks, cost, recruit, rates, tracking, first 100 sales, then diagnose a flat roster.