Marketing Budget Allocation by Company Stage
Marketing budget allocation by company stage: SaaS Capital's 8% median, equity-backed +100% vs bootstrap, and why unit economics beat round-label tables.
Organic vs paid growth channel comparison: First Page Sage B2B organic CAC $942 vs paid $1,907, why PPC can beat basic SEO, and the B2C flip.

TL;DR: Organic vs paid growth channel comparison is a speed, cost, and compounding tradeoff, not a virtue contest. First Page Sage’s ~120-firm sample puts B2B organic average CAC at $942 versus inorganic (paid) at $1,907. Inside those averages, PPC/SEM at $802 beats Basic SEO at $1,786. B2C averages flip ($480 organic vs $319 paid). Fund paid for speed, organic for compounding, and pick rows, not labels.
Boards love a clean organic vs paid growth channel comparison. After one expensive Meta quarter, someone says “we should go all organic.” After a quiet SEO quarter, someone says “just buy the leads.” Both lines treat the category label as destiny.
It is not.
First Page Sage’s 2026 CAC-by-channel table, built from high-performing campaigns across roughly 120 firms (Dec 2021-Nov 2024), puts B2B organic average CAC at $942 and inorganic average CAC at $1,907 (First Page Sage). That is about a 2× gap at the category level. Then look at the rows: PPC/SEM sits at $802, while Basic SEO sits at $1,786. A cheap paid row can beat an expensive organic row on the same table. Your mix should follow jobs, speed, and LTV:CAC, not a morality play (CAC vs LTV benchmarks by industry).
Key takeaways:
An organic vs paid growth channel comparison is the practice of weighing owned or earned acquisition (SEO, organic social, email, content, webinars, and similar) against paid or “inorganic” acquisition (PPC/SEM, paid social, ABM, PR buys, and similar) using cost, speed, and compounding, not slogan preference.
Organic here does not mean “free.” It means you primarily pay for production, people, and time rather than renting every click. Paid means the auction or media buy is the main lever. First Page Sage labels the second group inorganic and includes SDRs and ABM in that bucket for CAC reporting (First Page Sage).
This comparison is adjacent to brand-versus-performance mix (content marketing vs performance marketing) and to stage-level budget envelopes (marketing budget allocation by company stage). It is not a substitute for attribution grammar (attribution models compared).
Wrong mixes create two failure modes. All-paid companies rent growth and panic when CPCs rise. All-organic companies starve demand creation and blame “SEO” for a pipeline hole that paid could have filled in weeks.
Why this page earns space:
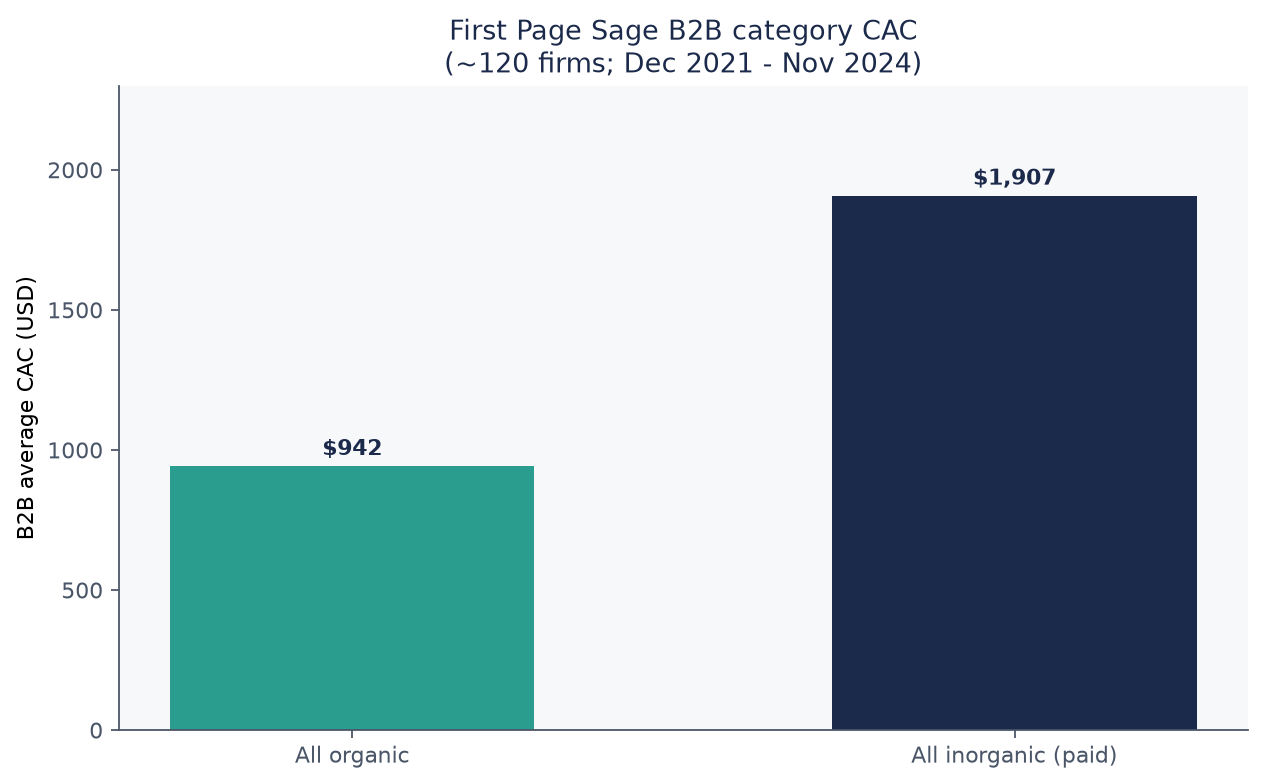
Source: First Page Sage, CAC by Channel - 2026 Benchmarks (~120 firms; campaigns Dec 2021-Nov 2024; 3-year averages). https://firstpagesage.com/marketing/cac-by-channel-fc/
Organic and paid channels compare on three axes: steady-state CAC, time until useful results, and what happens when you stop spending. Use category averages to orient, then force a row-level check so you do not fund the expensive version of your preferred ideology.
| Category | B2B average CAC | B2C average CAC |
|---|---|---|
| All organic channels | $942 | $480 |
| All inorganic (paid) channels | $1,907 | $319 |
Source: First Page Sage, CAC by Channel - 2026 Benchmarks. Figures are 3-year averages from high-performing agency campaigns and include a typical 4-6 month learning period where CAC is higher.
For B2B, organic wins the category average by about 2×. For B2C in this sample, paid wins the category average. That is why “organic is always cheaper” fails as a universal rule.
| Channel | Type | B2B CAC | Note |
|---|---|---|---|
| Email marketing | Organic | $510 | Cheap nurture, not cold acquisition alone |
| Thought Leadership SEO | Organic | $647 | Efficient compounding row |
| Webinars | Organic | $603 | Mid-funnel education |
| PPC / SEM | Inorganic | $802 | Cheapest paid row; beats several organic rows |
| LinkedIn Ads | Inorganic | $982 | B2B paid social |
| Content marketing | Organic | $1,254 | Broader than TL SEO in this taxonomy |
| Basic SEO | Organic | $1,786 | Expensive organic when quality is thin |
| Industry trade shows | Organic | $1,390 | High touch, high cost |
| Account-based marketing | Inorganic | $4,664 | High CAC reserved for high LTV accounts |
Source: First Page Sage.
The decision lesson is blunt. Prefer Thought Leadership SEO over “SEO” as a vague line item. Prefer targeted PPC over “more paid” as a vague line item. ABM at $4,664 can still be rational when LTV clears a 3:1 ratio with room for overhead.
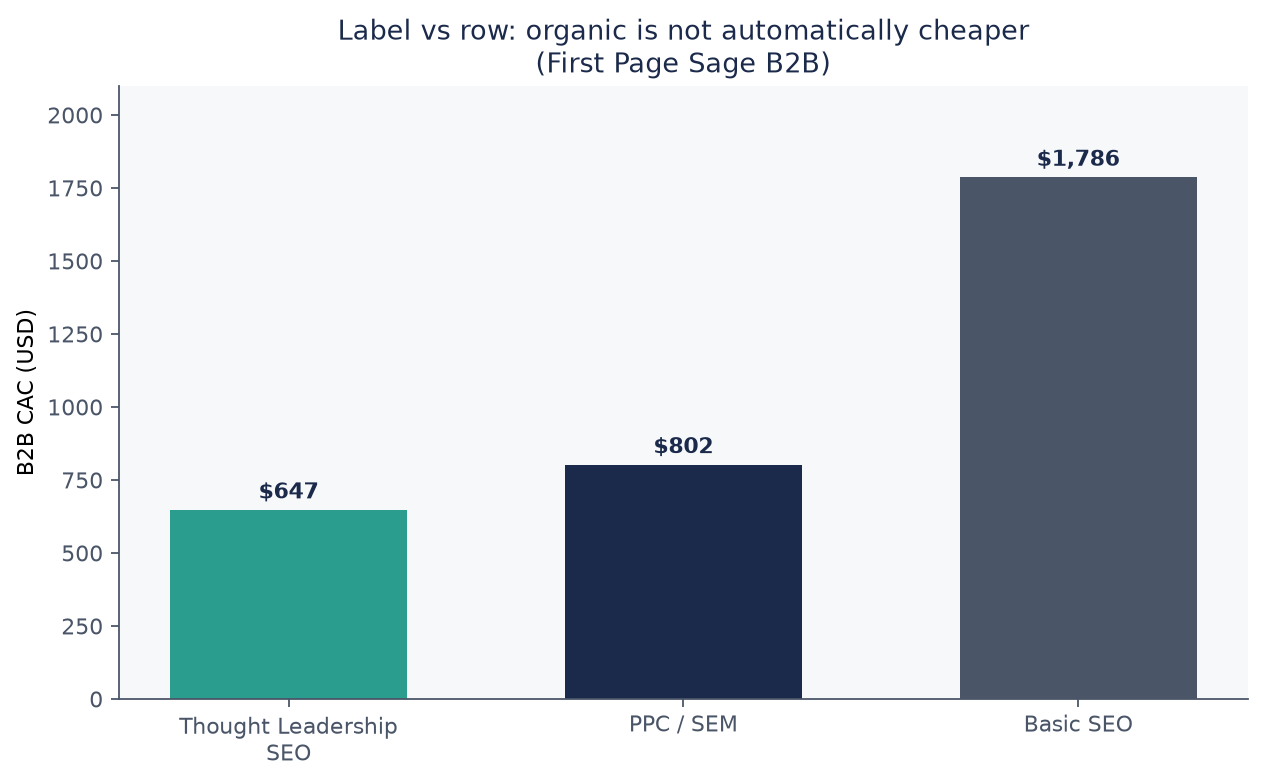
Source: First Page Sage, CAC by Channel - 2026 Benchmarks. https://firstpagesage.com/marketing/cac-by-channel-fc/
| Channel | Time until results (FPS) | Reported ROI (FPS) | Role |
|---|---|---|---|
| PPC / SEM | 1 month | 36% | Fast discovery / harvest |
| LinkedIn Advertising | 3-4 months | 192% | B2B paid discovery |
| 3-6 months | 312% | Nurture | |
| Thought Leadership SEO | 4-6 months | 748% | Compounding discovery |
| ABM | 4-8 months | 240% | High-touch account motion |
| Podcasts | 12-18 months | 307% | Slow brand/nurture |
Source: First Page Sage, Demand Generation Channels for 2026, Compared (table cites CAC by Channel plus FPS ROI statistics). Treat ROI percentages as that report’s published channel figures, not as your guarantee.
Paid buys calendar time. Organic buys asset time. If you need pipeline this quarter, starving paid because “SEO has higher ROI” is how you miss quota while you wait for month five.
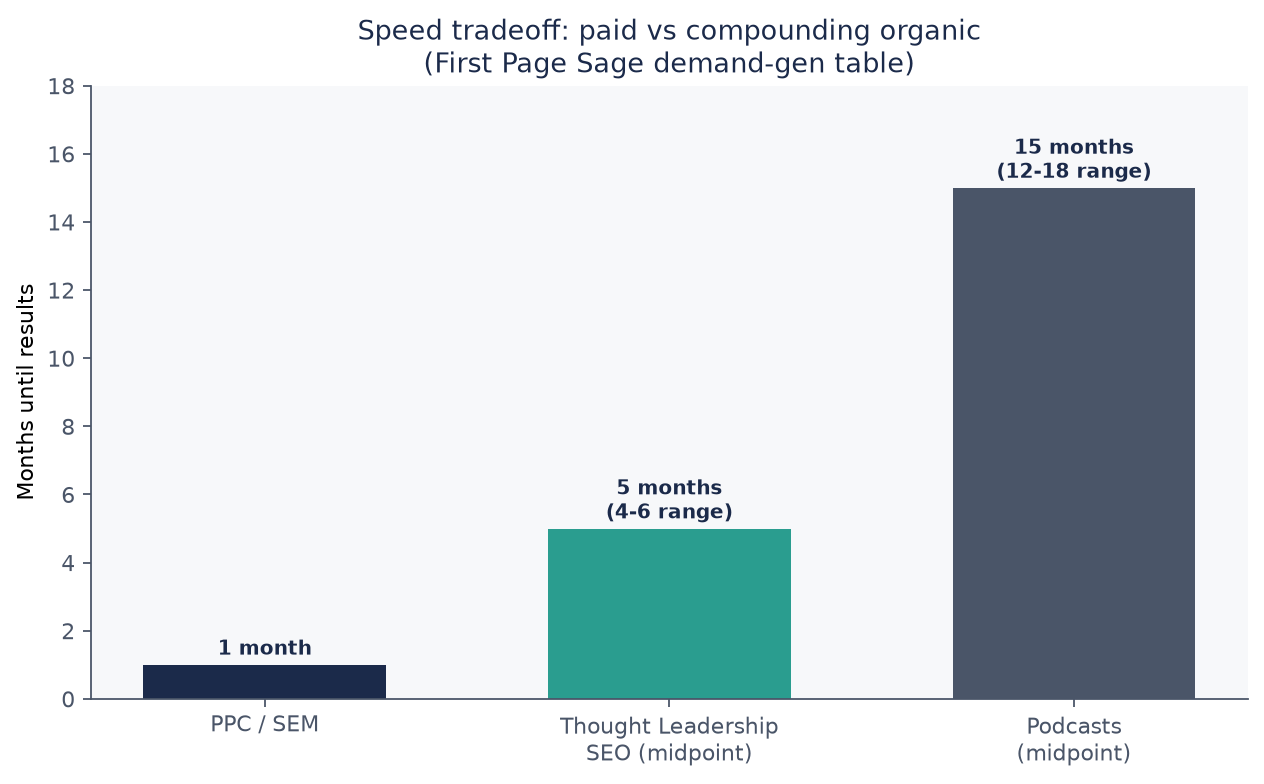
Source: First Page Sage, Demand Generation Channels for 2026, Compared (PPC 1 month; Thought Leadership SEO 4-6 months shown at midpoint 5; Podcasts 12-18 months shown at midpoint 15). https://firstpagesage.com/seo-blog/demand-generation-channels-compared/
First Page Sage’s industry edition (Jan 2022-Aug 2025) splits organic (primarily SEO and organic social) from inorganic (primarily PPC/SEM and paid social). Combined averages are weighted 75% organic / 25% inorganic, reflecting that agency’s service mix, so do not treat combined as a census blend (B2B Edition).
| Industry | Organic CAC | Inorganic CAC | Combined (75/25 weighted) |
|---|---|---|---|
| B2B SaaS | $205 | $341 | $239 |
| Legal services | $584 | $1,245 | $749 |
| Financial services | $644 | $1,202 | $784 |
| Education | $862 | $1,985 | $1,143 |
| eCommerce (in B2B table) | $87 | $81 | $86 |
| Pharmaceutical | $196 | $160 | $187 |
Paid exceeds organic in most rows. Ecommerce and pharmaceutical in this table are reminders that auctions and industry structure can invert the story. For funnel-quality differences between SEO and PPC leads, see marketing funnel benchmarks by stage and industry.
| If your constraint is… | Lean | Why | Watch-out |
|---|---|---|---|
| Need customers in under ~60 days | Paid (PPC/SEM, paid social) | FPS puts PPC near 1 month to results | CAC and ROI can look worse; keep LTV:CAC |
| Building durable inbound for 6-18 months | Organic (TL SEO, email, webinars) | Lower B2B category CAC; higher reported ROI on TL SEO | Learning period makes early CAC ugly |
| High ACV enterprise accounts | Hybrid; ABM only with LTV math | ABM CAC $4,664 needs large LTV | Do not use ABM CAC as a SMB template |
| Thin-margin B2C ecommerce | Test paid rows carefully | B2C inorganic avg $319 vs organic $480 in FPS sample | Sample skew; prove with your MER |
| Unclear attribution | Separate create vs harvest scorecards | Last-click under-credits organic assists | Use MTA/MMM/lift stack (incrementality testing) |
Choosing an organic vs paid mix means naming the job, checking category averages, forcing a row-level CAC, setting a speed requirement, and gating with LTV:CAC. Skip the all-or-nothing manifesto.
Q: What does an organic vs paid growth channel comparison show in 2026 benchmarks? A: First Page Sage’s channel table puts B2B organic average CAC near $942 and inorganic average CAC near $1,907, about a 2× gap. Inside the table, PPC/SEM at $802 beats Basic SEO at $1,786. B2C category averages flip ($480 organic vs $319 paid) in a sample skewed to higher-ticket goods.
Q: Is organic CAC always lower than paid CAC? A: No. B2B category averages favor organic in First Page Sage’s ~120-firm sample, but several paid rows beat several organic rows, and B2C category averages favor inorganic in that same report. Industry tables also show ecommerce and pharmaceutical cases where inorganic undercuts organic.
Q: How long until organic SEO results versus PPC? A: First Page Sage’s demand-generation comparison lists PPC/SEM at about 1 month to results and Thought Leadership SEO at 4-6 months. Podcasts sit at 12-18 months. Plan cash and pipeline for that lag instead of declaring SEO “broken” in month two.
Q: What is a good LTV:CAC when mixing organic and paid? A: First Page Sage restates a healthy target near 3:1 (pay $1 to make $3 in revenue, with room for overhead). That matches the common SaaS floor discussed in our CAC vs LTV benchmarks. Set the ratio on fully loaded costs, then compare channels inside it.
Q: Should startups go all organic to save money? A: Usually no. Organic often wins steady-state B2B CAC, but early companies still need paid for learning speed and demand fill while content compounds. Fund a hybrid with explicit speed SLAs, then shift weight as organic CAC falls after the learning period.
Organic vs paid growth channel comparison is a portfolio problem. B2B averages favor organic cost, paid wins on speed, and row selection beats category slogans. Use First Page Sage’s $942 vs $1,907 B2B averages to orient, then refuse any plan that cannot name the channel, the lag, and the LTV:CAC gate.
If you build products and want affiliates to sell them through co-branded storefronts with a revenue split on every sale, start at feat..
Marketing budget allocation by company stage: SaaS Capital's 8% median, equity-backed +100% vs bootstrap, and why unit economics beat round-label tables.
Marketing funnel benchmarks by stage and industry: First Page Sage Lead-to-MQL rates, channel gaps, and why B2B and ecommerce funnels differ.
Affiliate marketing for startups is an operating system—locks, cost, recruit, rates, tracking, first 100 sales, then diagnose a flat roster.