Email Preference Center Best Practices
Preference center best practices: CAN-SPAM menu plus stop-all, Google one-click vs body preference pages, and SendGrid's labeled 20% unsub drop.
SMS marketing vs email benchmarks: Omnisend same-base CTR, conversion, and $ per send, plus why SMS has no open rate like email.

TL;DR: SMS marketing vs email benchmarks are a job choice, not a winner-take-all scoreboard. Omnisend’s same ecommerce base puts SMS campaign CTR at 12.39% versus email 0.74%, while email automations earn $3.41 per send versus SMS $0.74. Standard SMS has no dependable open rate. Plan urgency on SMS and depth on email.
Founders ask whether SMS or email “wins,” then paste a 98% SMS open rate next to a 30% email open rate and call it settled. That slide is theater. SMS does not report opens the way email does. Misread the metrics and you burn a phone list or starve the inbox.
The full cluster map lives in the email marketing guide.
SMS marketing vs email benchmarks are labeled click, conversion, and revenue figures for the two channels on a comparable ecommerce base, plus the hard rule that SMS has no ESP-managed open rate. Broader email industry ladders live in email marketing benchmarks by industry. Cart, welcome, and browse email spokes live in abandoned cart email benchmarks, welcome email benchmarks, and browse abandonment email benchmarks.
SMS marketing vs email benchmarks are side-by-side performance ranges for promotional and automated messages sent by text versus email, usually reported as click-through rate, conversion or placed-order rate, and revenue per send from a named sample you can cite.
They are not a single “which is better” average. SMS reaches one personal device with roughly 160 characters and per-message cost. Email reaches inboxes across devices with room for story, proof, and product grids. Omnisend’s comparison is useful because the SMS and email figures come from the same ecommerce brand base in 2025, which reduces the usual apples-to-oranges trap when vendors publish each channel alone.
On r/ecommerce and r/shopify_growth, operators already say the quiet part: use them in tandem, SMS for urgency, email for depth, and do not blast the phone list like a louder newsletter. The public datasets below give you numbers for that argument. The job is to keep the metric definitions attached.
These benchmarks matter because channel choice is a cost and consent decision, not a vanity contest. Misread opens and you overfund SMS. Misread automation dollars and you underfund email flows that still pay more per send on the same Omnisend base.
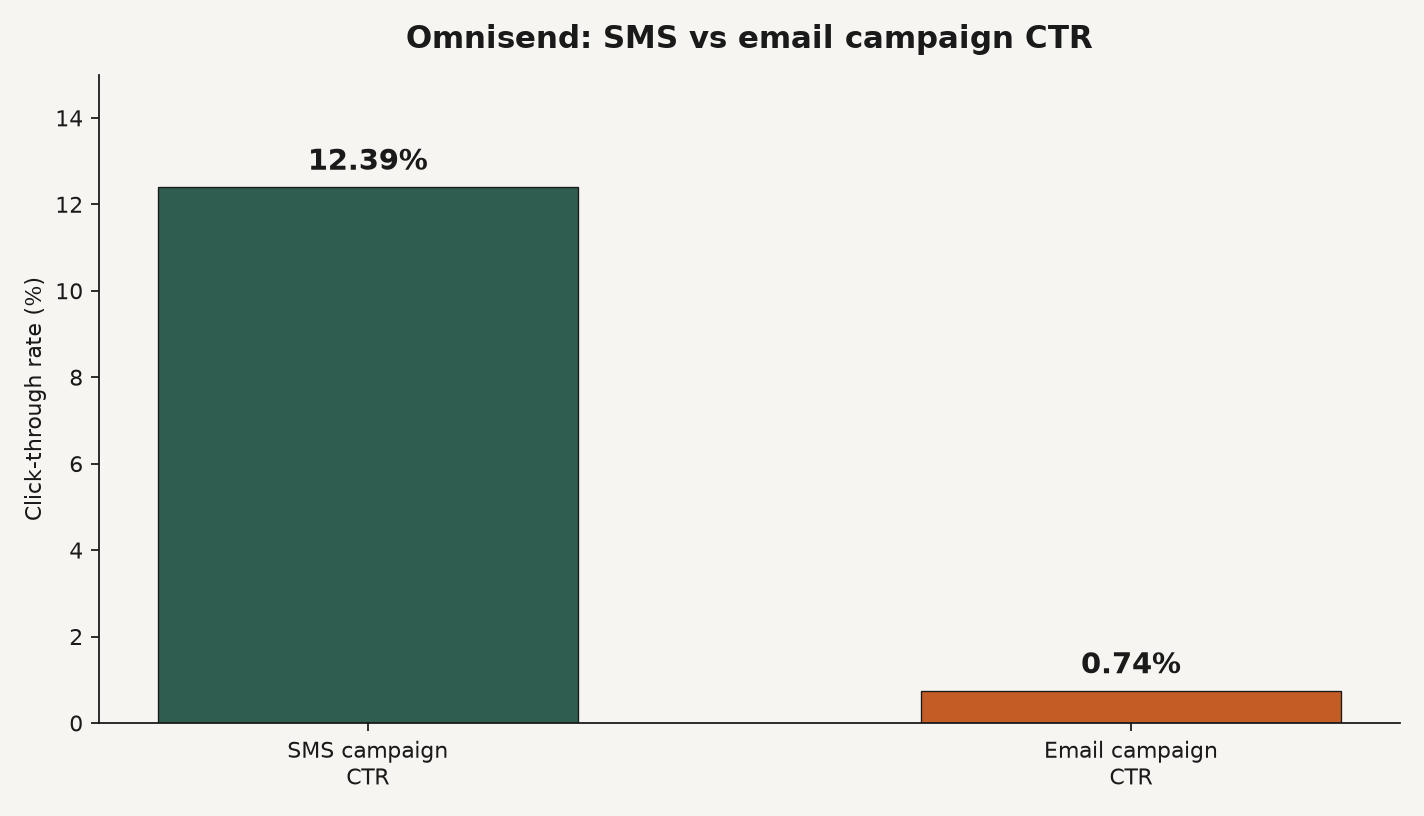
Source: Omnisend SMS marketing statistics (2025 ecommerce data; 2026 article). https://www.omnisend.com/blog/sms-marketing-statistics/
SMS marketing vs email benchmarks work as a same-base scorecard plus a job matrix. Read Omnisend’s SMS and email cells from one ecommerce sample. Manage both on CTR, conversion, and dollars, with email opens only directional. Assign urgency to SMS and depth to email, then sequence both instead of picking a permanent winner.
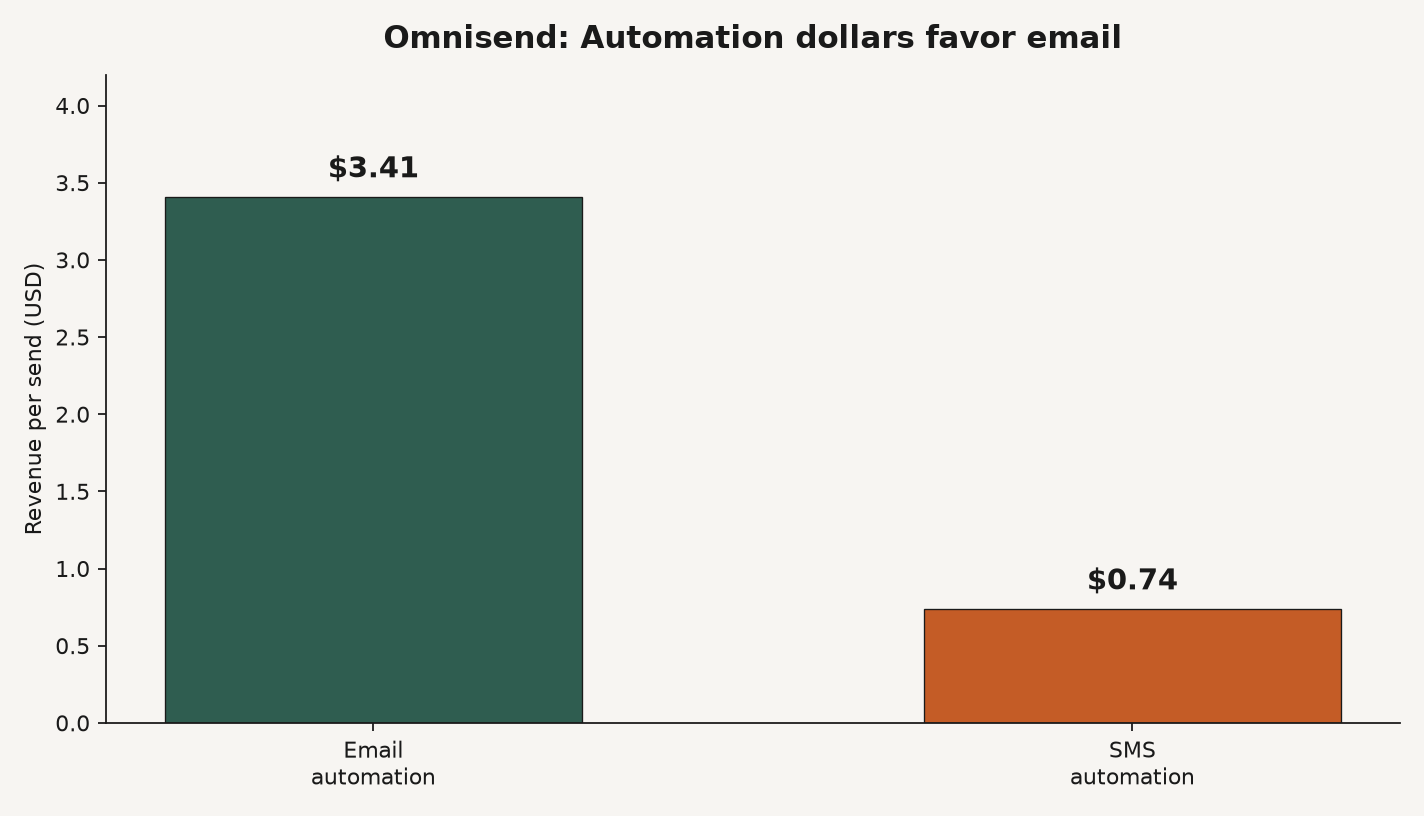
Source: Omnisend SMS marketing statistics, SMS vs email table (2025 data). https://www.omnisend.com/blog/sms-marketing-statistics/
| Metric | SMS | |
|---|---|---|
| Open rate | Not dependably tracked | 30.22% campaign average (MPP caveat) |
| Campaign CTR | 12.39% | 0.74% |
| Campaign conversion | 0.12% | 0.08% |
| Automation conversion | 0.77% | 1.49% |
| Automation revenue per send | $0.74 | $3.41 |
| Campaign revenue per send (SMS row) | $0.15 | see email report $0.155 |
Source: Omnisend SMS marketing statistics (same ecommerce brand base, 2025). Email campaign dollar also in Omnisend email benchmarks.
Read the table as jobs, not as a trophy. SMS is the interrupt channel that earns clicks on broadcasts. Email is the automation wallet that earns more per send when the message can carry proof, bundles, and a longer path to purchase. Klaviyo’s email cut still shows flows carrying nearly 41% of email revenue from 5.3% of sends, with flow click 5.58% versus campaign 1.69% (Klaviyo; detail on email benchmarks by industry).
| SMS metric | Campaign | Automation |
|---|---|---|
| CTR / click-to-sent | 12.39% | 20.34% |
| Conversion | 0.12% | 0.77% |
| Revenue per message | $0.15 | $0.74 |
| Click-to-conversion | 0.97% global | 3.81% |
| Deliverability | 96.6% | 92.8% |
Source: Omnisend SMS marketing statistics. Automation conversion is also cited as 0.78% in the automation section; use the labeled cell you cite.
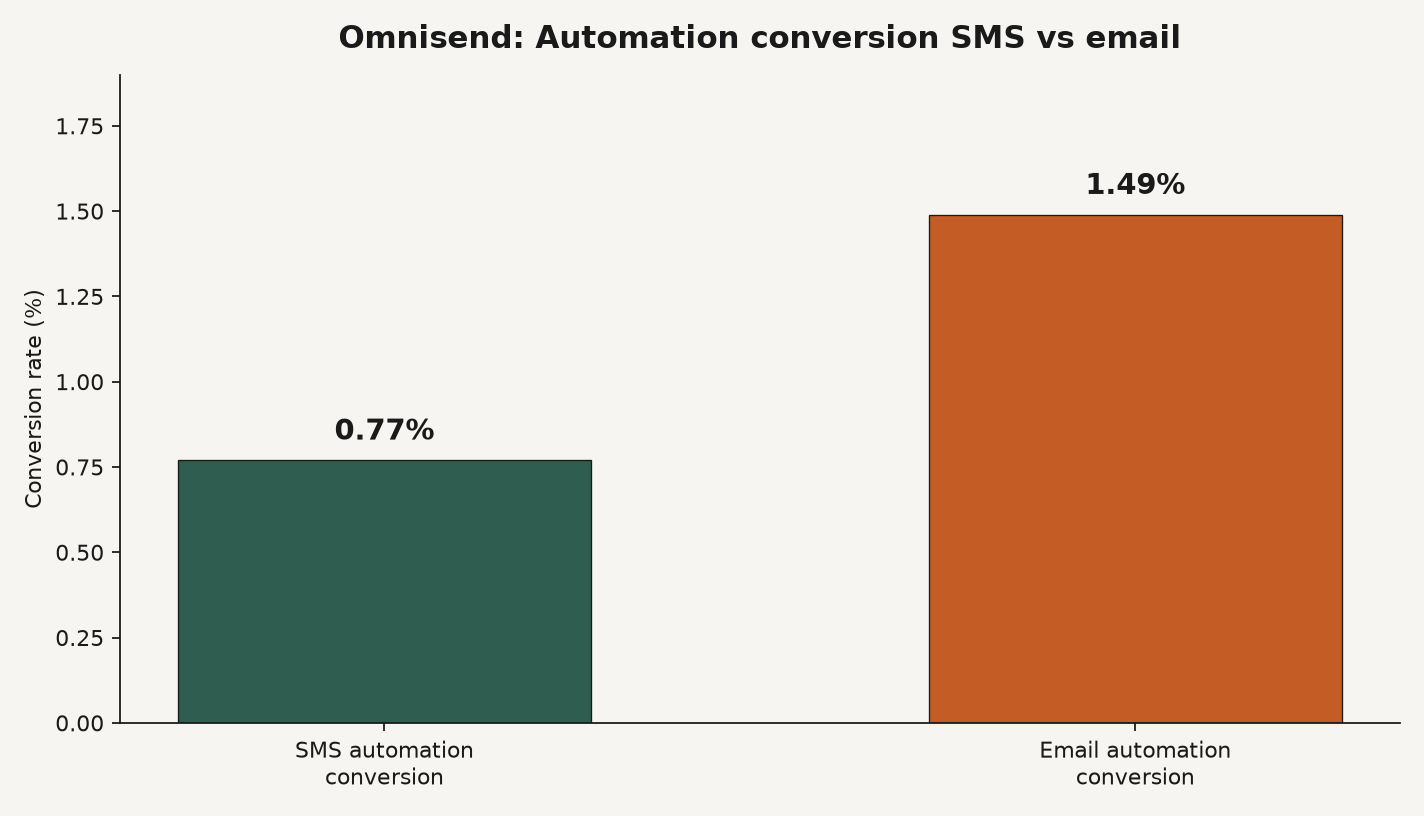
Source: Omnisend SMS marketing statistics, SMS vs email table. https://www.omnisend.com/blog/sms-marketing-statistics/
If your SMS campaign CTR collapses toward email campaign CTR, your list, offer, or link is the suspect. If your automated SMS dollars trail email automation by the Omnisend gap ($0.74 vs $3.41) and you expected parity, you were measuring the wrong job.
Omnisend’s SMS vs email explainer also publishes email automation at $2.87 per send versus campaign $0.18 (16×), with SMS automation still at $0.74 versus campaign $0.15 (5×), and email open near 30.7% (Omnisend). That page’s click-to-conversion cells (0.97% SMS global; 9% email) are a different cut than the statistics table’s conversion rates. Keep $2.87 and $3.41 in separate cells. Do not invent a midpoint “industry email automation RPR.”
| Moment | Prefer email | Prefer SMS |
|---|---|---|
| New subscriber | Brand story, proof, catalog | Short welcome offer if email ignored |
| Browse / cart | Browse and cart sequences with product detail | Time-limited cart nudge after email |
| Purchase | Order confirmation, upsell, care guides | Shipping and delivery pings |
| Promotions | Newsletters, seasonal stories | Flash sales and last-call windows |
| Retention | Birthday, review, education | Restock alerts, thank-you offers |
Source: Editorial matrix synthesizing Omnisend’s moment table (SMS vs email) with the same-base metrics above.
Community threads on r/ecommerce and r/shopify_growth match this split: SMS for time-sensitive offers, email for volume and storytelling, tandem beats either alone when frequency caps hold. Omnisend’s labeled brand examples (INGLOT Canada 2,130% revenue-per-message lift pairing channels; multichannel cart 117% better conversion than email-only) are case studies, not a universal lift census (Omnisend).
SMS usually prices per message. Email usually prices by contacts or send volume. Omnisend’s explainer notes Pro-plan SMS credits starting near $0.009 per U.S. SMS in its published example (Omnisend). Both channels need explicit opt-in for marketing under the rules that apply to your market (TCPA, GDPR, CASL, CAN-SPAM). This page is not legal advice. Frequency is the practical killer: EZ Texting-cited data in Omnisend’s roundup puts excessive frequency as the top opt-out trigger at 40% (Omnisend). Treat the phone like a VIP channel, not a louder newsletter.
There is no public dataset that publishes one official SMS open rate managed the way email opens are tracked. Secondary posts that lead with 98% SMS opens or 21%-40% SMS conversion bands without a named ecommerce ESP census stay out of the charts. feat. does not publish a proprietary SMS versus email ROI study here. Attentive Cyber Week peak figures are seasonal anecdotes, not year-round averages for this scorecard.
Using SMS marketing vs email benchmarks means assigning jobs before you assign budgets. Fund email automations for depth and dollars. Fund SMS for interrupt CTR and time-boxed offers. Cap SMS frequency. Never manage SMS with an invented open-rate target.
These answers restate the Omnisend same-base CTR and dollar ladder, the no-open-rate rule for SMS, and the urgency-versus-depth job split so a founder can quote labeled numbers without inventing one fake national SMS open average.
Q: What are good SMS marketing vs email benchmarks in 2026? A: On Omnisend’s same ecommerce base, SMS campaign CTR is 12.39% versus email 0.74%, while email automations earn $3.41 per send versus SMS $0.74. Automation conversion favors email (1.49% vs 0.77%). Campaign conversion is close (0.12% SMS vs 0.08% email).
Q: Does SMS have a higher open rate than email? A: You usually cannot measure SMS opens the way you measure email opens. Omnisend states standard SMS has no dependable open tracking. Email campaign opens near 30.22% on Omnisend’s table are already directional under Apple Mail Privacy Protection. Prefer CTR and conversion for SMS.
Q: Is SMS more effective than email for ecommerce? A: Effective at what. SMS is more effective for interrupt clicks and time-sensitive nudges. Email is more effective for automation revenue per send and detail-rich journeys on Omnisend’s labeled samples. The better stack uses both with frequency caps.
Q: How do SMS and email automations compare on revenue? A: Omnisend’s comparison table puts automated email at $3.41 per send and automated SMS at $0.74. Inside SMS alone, automations still beat campaigns ($0.74 vs $0.15). Do not average that with Omnisend’s alternate $2.87 email automation cell from a sibling page.
Q: Should I replace email with SMS? A: No. HubSpot’s 2026 survey cited by Omnisend still shows email used by 40% of marketers versus mobile messaging at 14%. Replace blasts that ignore consent and fatigue, not the email automation wallet that pays more per send on the published ladder.
SMS marketing vs email benchmarks are a definition problem before they are a creative problem. Keep SMS campaign CTR 12.39% and email automation $3.41 in separate channel jobs, and refuse inventing one fake national SMS open-rate average.
Sequence both channels instead of crowning a permanent winner. Browse the feat. marketplace if creators should sell an owned product through the same lifecycle journeys your SMS and email flows already fund.
Preference center best practices: CAN-SPAM menu plus stop-all, Google one-click vs body preference pages, and SendGrid's labeled 20% unsub drop.
Mailchimp vs Klaviyo: contact billing fork, send multipliers (10x/12x/15x), starting prices, and when ecommerce depth beats a general ESP.
Email list growth benchmarks: Omnisend 1.24B popup displays at 2.1%, form-type ladder, and levers that beat the average without inventing MoM %s.