Average Cost per Content Piece by Format (2026 Ranges)
Average cost per content piece by format: WebFX ranges, freelancer modal rates, and why one national average is a myth.
Content marketing ROI benchmarks by industry: First Page Sage 3-year ladders, the 748% vs 16% quality gap, and how to set expectations without myth math.

TL;DR: Content marketing ROI benchmarks by industry only help when you name three things: the vertical, the quality tier, and the multi-year window. First Page Sage’s industry report (updated Sept 22, 2023) shows 3-year ROI from about 844% (biotech) to 1,486% (real estate) in its client set. Their 2026 SEO ROI service table is harsher: Thought Leadership & SEO at 748% versus Basic Content Marketing at 16%. Industry averages without quality are fiction with a decimal point.
Founders Google content marketing ROI benchmarks by industry, then paste a single “average ROI” into a board deck. Finance asks when it pays back. The slide cannot answer, because the slide never named the vertical, the content quality, or the year of the compounding curve.
A biotech campaign and a basic four-posts-a-month blog are not the same asset class. Treating them as one number is how content budgets die in month six.
First Page Sage publishes two datasets founders can actually cite. The Content Marketing ROI Statistics by Industry report (last updated September 22, 2023) breaks 3-year new revenue and ROI across twelve verticals in their measured client set. The SEO ROI Statistics 2026 report, built on campaigns from Q1 2021 through Q3 2025, separates Technical SEO, Basic Content Marketing, and Thought Leadership & SEO. Read them together. The industry ladder sets the ceiling for high-LTV verticals. The quality fork explains why many “content programs” never clear the floor.
Key takeaways:
Content marketing ROI benchmarks by industry are published ranges for return on content investment, segmented by vertical, so teams can set expectations against peers with similar deal sizes, sales cycles, and search demand, not against a single universal average.
They are not a promise that your next post will return 1,000%. They are not a substitute for your own cohort tracking. They are a calibration tool: “companies like ours, running content at this quality, often see returns in this band over this horizon.”
Three definitions keep the math honest:
If your program is four average posts a month with no hub structure, do not quote the real-estate 1,486% row. Quote the basic-content row instead, or fix the program.
Benchmarks matter because content is a compounding asset that finance still books like a campaign. Without industry and quality context, leadership either overfunds mediocre publishing or kills a program one quarter before the curve bends.
Why this page earns space:
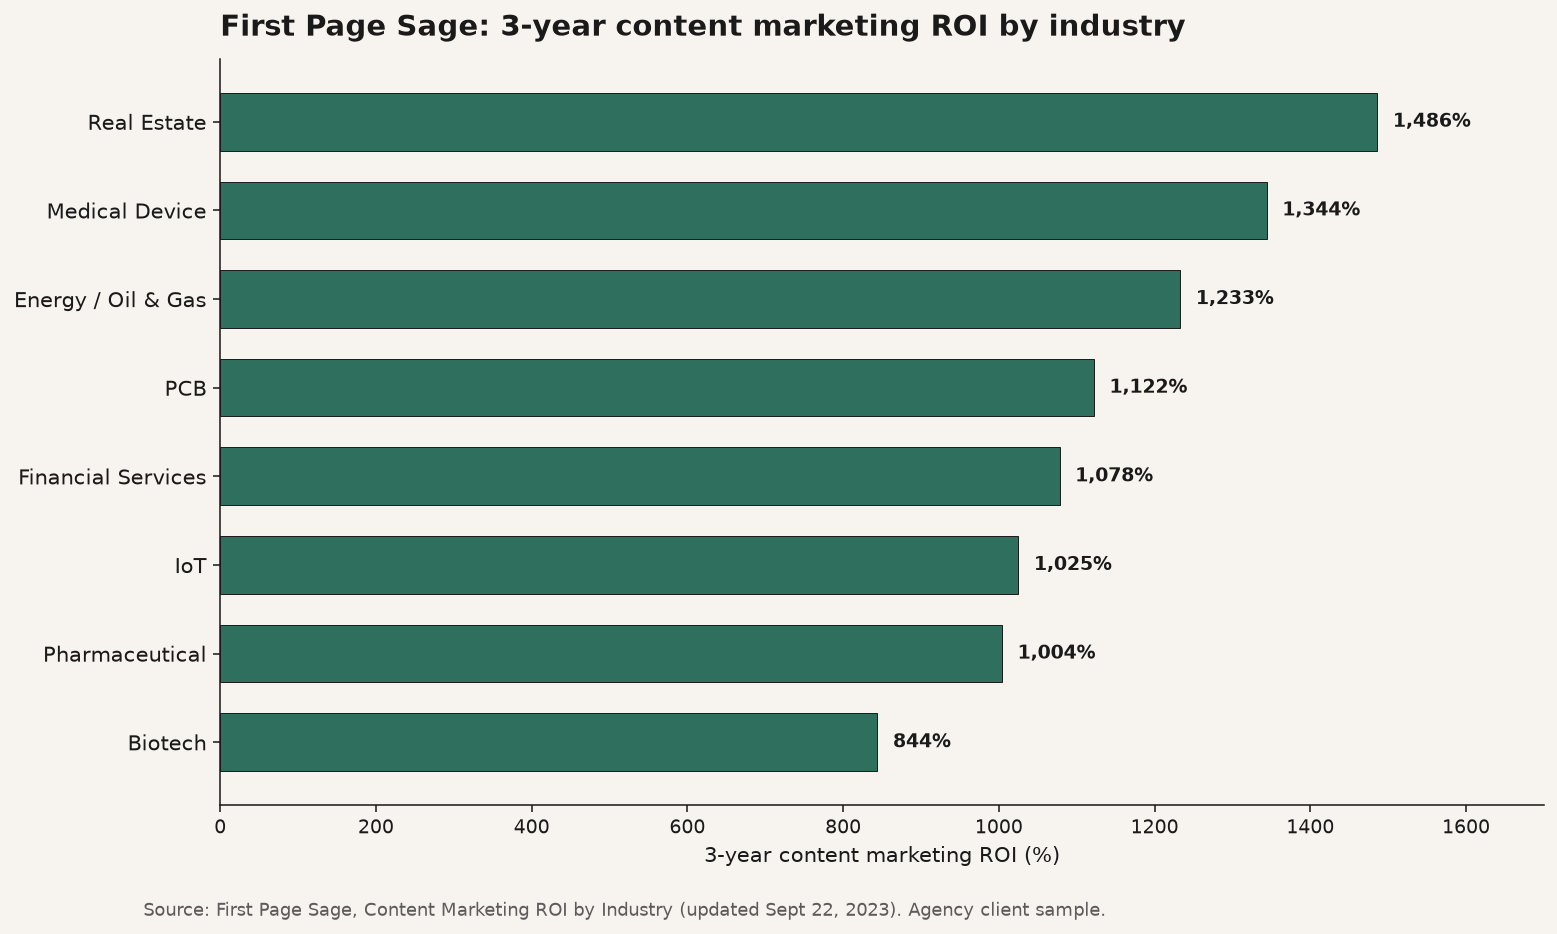
Source: First Page Sage, Content Marketing ROI Statistics by Industry (last updated Sept 22, 2023). Agency client sample; not a public census. https://firstpagesage.com/reports/content-marketing-roi-statistics-by-industry-fc/
Content marketing ROI benchmarks work when you read them as a three-axis scorecard: industry band, quality tier, and time horizon. They fail when you collapse those axes into one vanity percentage for a board slide.
Selected 3-year averages from First Page Sage’s content marketing ROI by industry report:
| Industry | 3-year avg new revenue | 3-year ROI | Year 1 ROI | Landing page CVR |
|---|---|---|---|---|
| Real Estate | $2.3M | 1,486% | 659% | 2.8% |
| Medical Device | $2.2M | 1,344% | 700% | 3.1% |
| Energy / Oil & Gas | $2.0M | 1,233% | 433% | 3.1% |
| PCB | $1.8M | 1,122% | 300% | 2.3% |
| Financial Services | $1.8M | 1,078% | 367% | 1.9% |
| IoT | $1.8M | 1,025% | 400% | 2.2% |
| Pharmaceutical | $1.8M | 1,004% | 213% | 2.0% |
| Manufacturing | $1.6M | 967% | 367% | 1.1% |
| Solar | $1.6M | 900% | 287% | 1.8% |
| Higher Education | $1.4M | 856% | 300% | 1.4% |
| Insurance | $1.4M | 856% | 567% | 1.7% |
| Biotech | $1.1M | 844% | 367% | 1.3% |
Source: First Page Sage, Content Marketing ROI Statistics by Industry (Sept 22, 2023). FPS also states that at the highest execution level, average yearly ROI for a content marketing campaign is about $984,000 in their framing.
Read the table as relative, not destiny. Real estate and medical device sit at the top because deal value and search intent support thought leadership, not because “content always works in real estate.” Biotech’s lower dollar average still shows an 844% 3-year ROI in the same sample.
| SEO / content service type | ROAS | ROI | Time to break-even |
|---|---|---|---|
| Thought Leadership & SEO | 9.10 | 748% | 9 months |
| Technical SEO | 1.35 | 117% | 6 months |
| Basic Content Marketing | 1.05 | 16% | 15 months |
Source: First Page Sage, SEO ROI Statistics 2026. Dataset: SEO campaigns Q1 2021-Q3 2025. Thought leadership here means strategic hubs and spokes, audience research, and about 6-8 high-quality pages per month (with generative-engine optimization in the strategy). Basic content marketing means cursory keyword research and about 4 average-quality blogs per month. Cost base includes agency fees (FPS cites about $120,000/year in their methodology) plus a share of client-side salaries.
This is the editorial stake: if your “content ROI” conversation never mentions quality tier, you are comparing a compounding asset to a content treadmill.
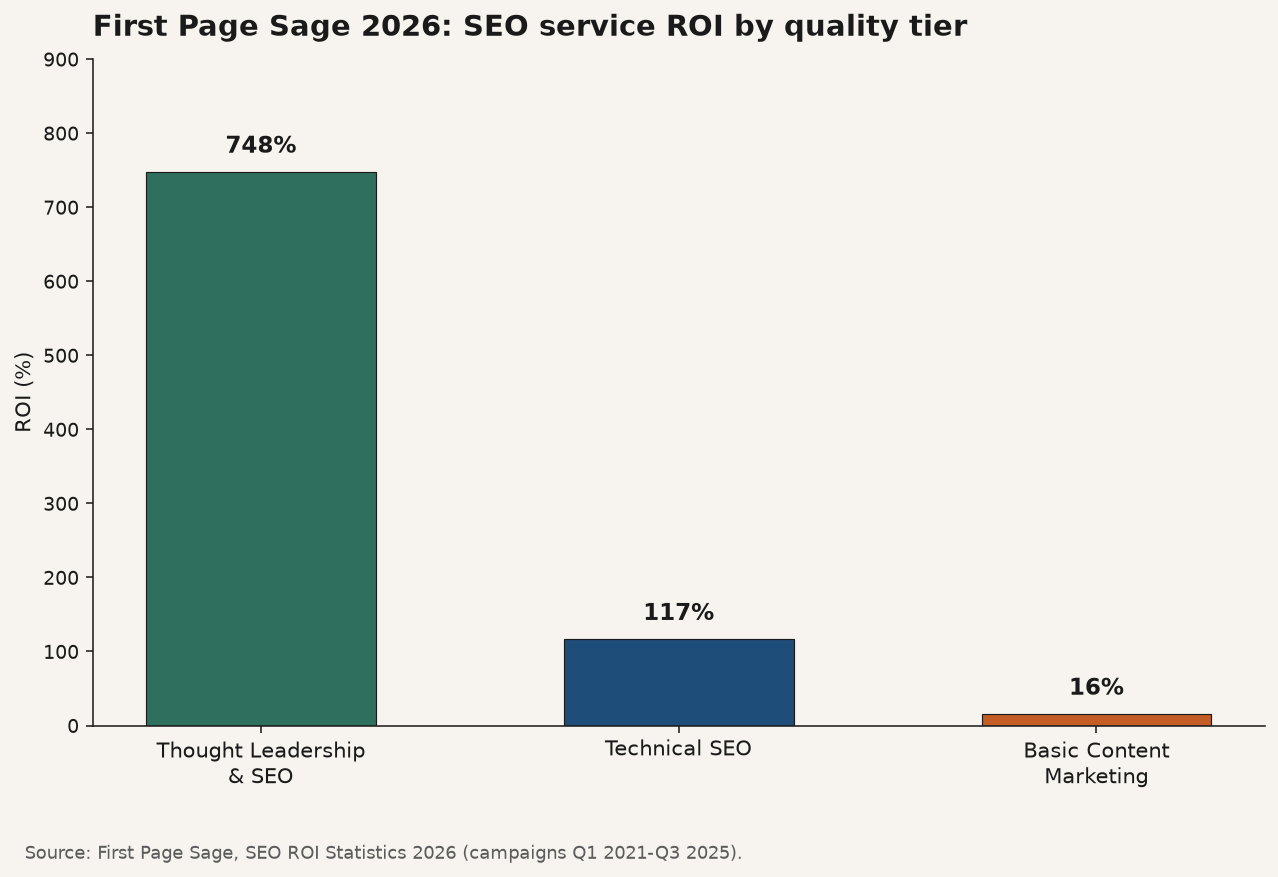
Source: First Page Sage, SEO ROI Statistics 2026 (campaigns Q1 2021-Q3 2025). https://firstpagesage.com/seo-blog/seo-roi-statistics/
Year-one ROI in the 2023 industry table is often a fraction of the 3-year figure. Pharmaceutical Year 1 sits at 213% while the 3-year average reaches 1,004%. Energy moves from 433% in Year 1 toward 1,233% over three years. Plan cash for the lag. Do not declare content “broken” because month four looks quiet while rankings are still forming.
The 2026 SEO report repeats the same shape: positive ROI typically lands in a 6-12 month window, with peaks in year two or three, and works best when customer LTV is relatively high (FPS cites $10,000+ as a practical bar for thought-leadership SEO candidates).
| Claim type | Use when | Refuse when |
|---|---|---|
| FPS industry 3-year ROI % | Setting vertical expectations with agency-sample caveat | Treating it as your guaranteed return |
| FPS service quality ROI | Choosing thought leadership vs basic blogs | Blaming “content” after shipping low-quality posts |
| Your cohort iROAS / incrementality | Budget kill decisions | Board vanity without a holdout |
| Secondary “300% average” listicles | Almost never | Methods, sample, and date are missing |
For kill decisions, prefer an incrementality design over a recycled average (incrementality testing explained). For topical structure that makes thought leadership possible, build hubs on purpose (how to build a topic cluster).
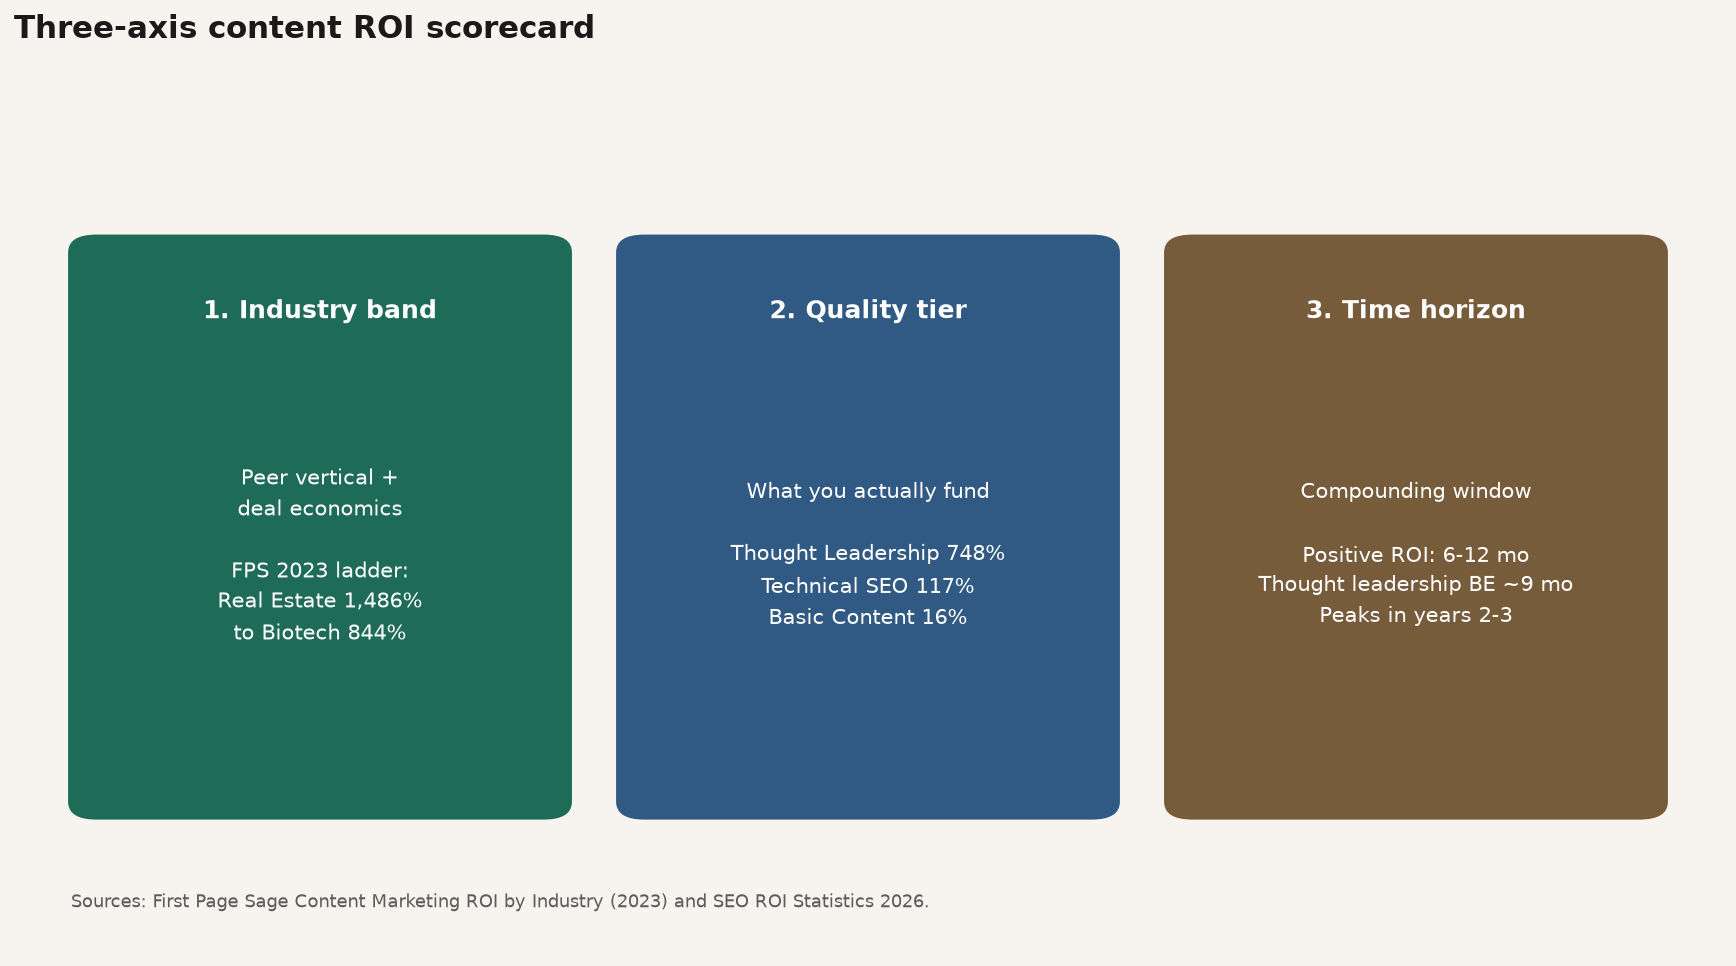
Source: Editorial framework combining First Page Sage Content Marketing ROI by Industry (2023) and SEO ROI Statistics 2026 service definitions. https://firstpagesage.com/reports/content-marketing-roi-statistics-by-industry-fc/
Using content marketing ROI benchmarks means picking a peer vertical, picking a quality tier you will actually fund, setting a multi-year window, and measuring your own cohorts instead of worshiping someone else’s percentage.
Q: What are content marketing ROI benchmarks by industry? A: They are published return ranges for content investment, broken out by vertical so teams can compare against peers with similar deal sizes and sales cycles. First Page Sage’s September 2023 industry report lists 3-year ROI from about 844% in biotech to 1,486% in real estate inside its client sample. Always pair the vertical with a quality tier and a multi-year window.
Q: What is a good average content marketing ROI? A: There is no single good average. First Page Sage’s 2026 SEO service table puts Thought Leadership & SEO near 748% ROI and Basic Content Marketing near 16% over a three-year framing. A “good” number is one that matches your industry band, your funded quality tier, and a horizon long enough for compounding.
Q: Why do some industries show higher content marketing ROI? A: High-LTV, research-heavy verticals support thought leadership that ranks for valuable terms and converts expensive deals. In FPS’s 2023 content report, real estate (1,486%), medical device (1,344%), and energy (1,233%) lead the 3-year ROI list. Lower rows can still be strongly positive without matching those dollar totals.
Q: How long until content marketing ROI turns positive? A: First Page Sage’s 2026 SEO ROI report places typical positive ROI in a 6-12 month window, with break-even near 9 months for thought leadership and about 15 months for basic content marketing. Peak results often arrive in year two or three, which is why year-one snapshots mislead.
Q: Can I use the same ROI benchmark for basic blogs and thought leadership? A: No. That is the most expensive mistake in the dataset. FPS separates Basic Content Marketing (16% ROI) from Thought Leadership & SEO (748% ROI) in its 2026 service table. If you fund the basic tier, do not present thought-leadership benchmarks to finance.
Content marketing ROI benchmarks by industry are a three-axis tool, not a lottery ticket. Name the vertical band from a dated primary table, name the quality tier you will actually ship, and give compounding enough calendar time to show up in revenue. Myth averages without methods deserve a delete key, not a board slide.
If you build products and want affiliates to distribute them through co-branded storefronts with a revenue split on every sale, start at feat..
Average cost per content piece by format: WebFX ranges, freelancer modal rates, and why one national average is a myth.
Evergreen vs trending content compared with OkDork share-decay data, evergreen format odds, and a job-first mix (not a fake 70/30).
How long content takes to rank by domain authority, with Ahrefs base rates, page-age data, and why DA score calendars are mostly fiction.